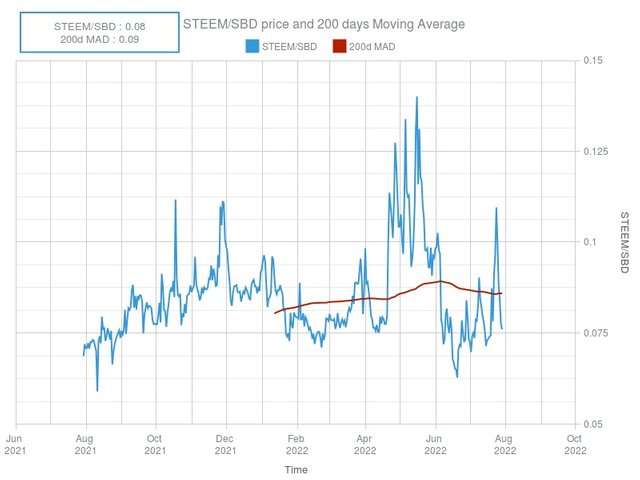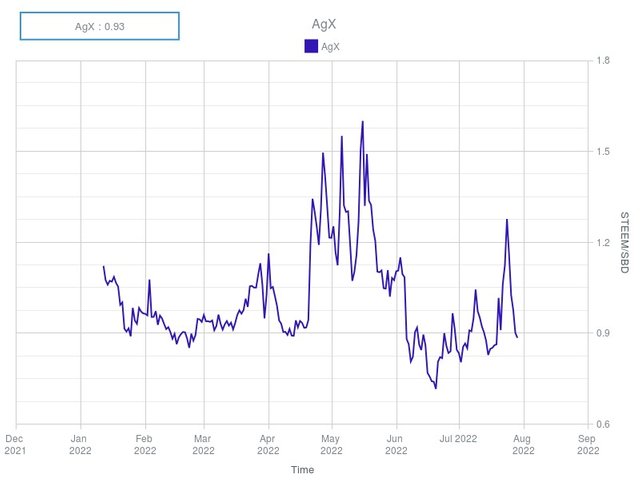
This is the chart for today 2022-07-30.
Today's 200 days moving average factor is 0.09 for a STEEM/SBD ratio of 0.08.
The AgX is factor is0.93.
You can use the chart below to provide some historic suggestions of what's been good previously. If the blue line is in the top third of the chart it's a good time to sell Steem. If it's in the bottom it's a good time to sell SBD. Past performance isn't a guarantee of current valuations or trends.
What is AgX?
The Mayer's multiple (200 days moving average of the BTC/USD price) is known to be a good indicator of the BTC price evolution.
AgX aims to be a similar indicator regarding the STEEM/SBD ratio, in order for users to find the right moment to exchange their SBD for STEEM at the best possible rate.
Original idea by @aggroed (Vote for witness)
Developed by @stoodkev (Vote for witness)
Your post was upvoted and resteemed on @crypto.defrag
Downvoting a post can decrease pending rewards and make it less visible. Common reasons:
Submit