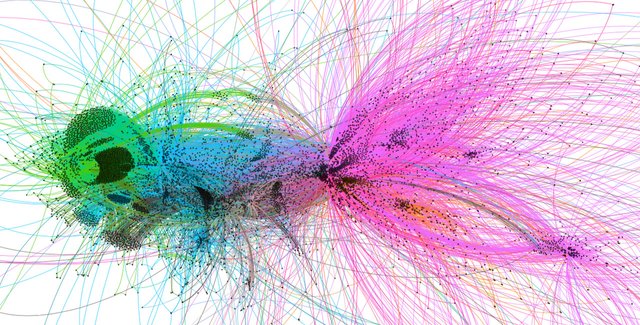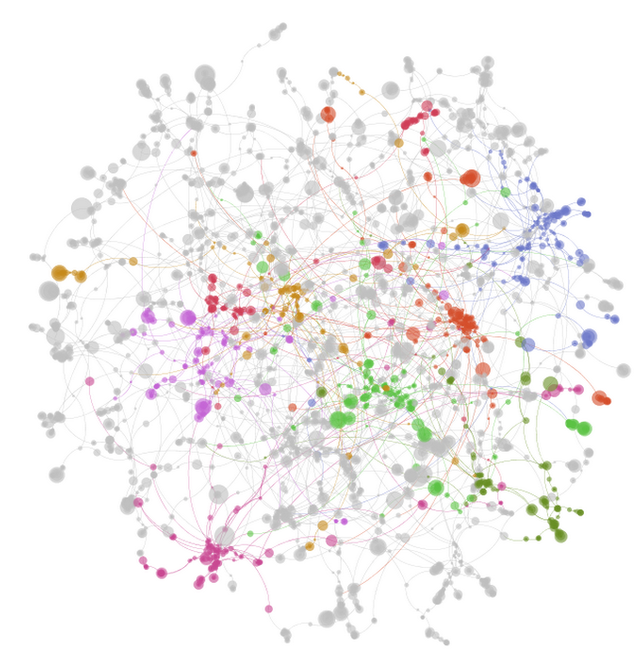
Ever wonder what blockchain actually looks like in live-action? Explore some of the examples by Allen Day and Evgeny Medvedev on how transactions on the Ethereum blockchain can be visualized in experimental ways. Now with the Ethereum datasets available on Google’s BigQuery public database, Day and Medvedev were able to look into, understand, and represent the major transaction qualities of the network. Here are some examples -

- Aggregate Ethereum Wallet Transactions

- CryptoKitties Pedigree amongst Owners
Name: Ethereum in BigQuery: A Public Dataset for smart contract analytics
Website: Link
Twitter: https://twitter.com/allenday


- CryptoKitties Pedigree amongst Owners
Name: Ethereum in BigQuery: A Public Dataset for smart contract analytics
Website: Link
Twitter: https://twitter.com/allenday

Posted from my blog with SteemPress : https://thecreativecrypto.com/visualizing-the-ethereum-blockchain-w-google-bigquery/
Following upvote resteem done
Downvoting a post can decrease pending rewards and make it less visible. Common reasons:
Submit
Awesome! Love these data visualizations.
Posted using Partiko Android
Downvoting a post can decrease pending rewards and make it less visible. Common reasons:
Submit
Thats very cool. How people create such images is way beyond my understanding but I think its neat how the images show the densities and expansion. Even though I do not understand what I am looking at fully, the visuals do help in that regard. Very cool :)
Downvoting a post can decrease pending rewards and make it less visible. Common reasons:
Submit
Very nice art forms based on the life on the blockchain. Quite impressive representations !
Downvoting a post can decrease pending rewards and make it less visible. Common reasons:
Submit