#BTC Update
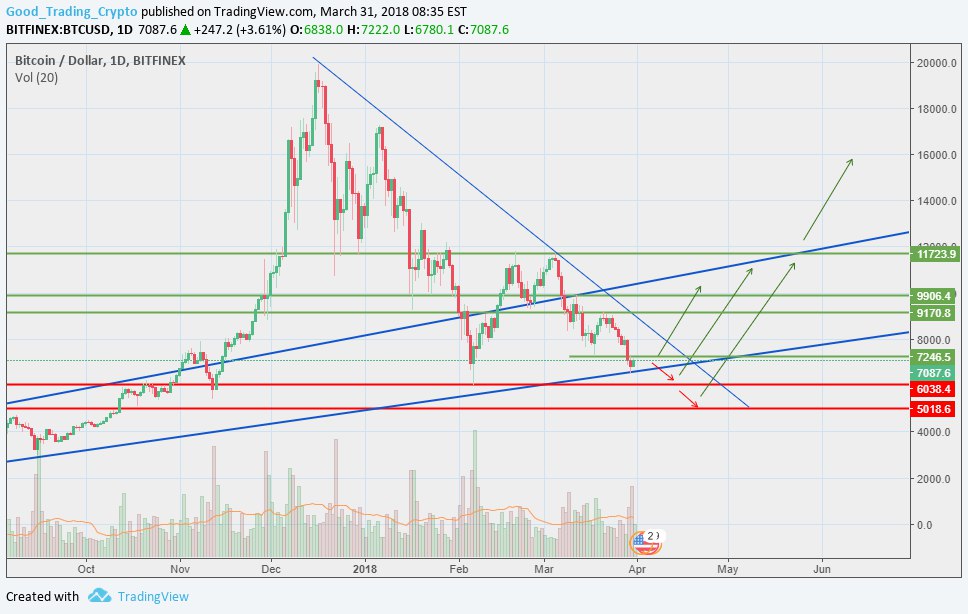
Red lines are strong support areas and good areas to buy if the price reaches them
If a $ 6500 area is broken by closing a candle below it, you will see the $ 6,000 support area and then $ 5000.
Green lines are resistive zones if broken, we will go to the next resistance and so on.
There is a rising channel that appears in blue where you can rely on it but on condition that its bottom line is not broken and if broken we will go to the red support lines.
Keep in mind that we are still in a bearish direction and until we move to the upside, break the $ 11750 resistance by closing the day candle above it.

Downvoting a post can decrease pending rewards and make it less visible. Common reasons:
Submit