Hi,
I see two main Bitcoin paths occurring, both bullish in the short run but one will correct soon to form a wedge. As always, I am not a financial advisor and this is an educational post.
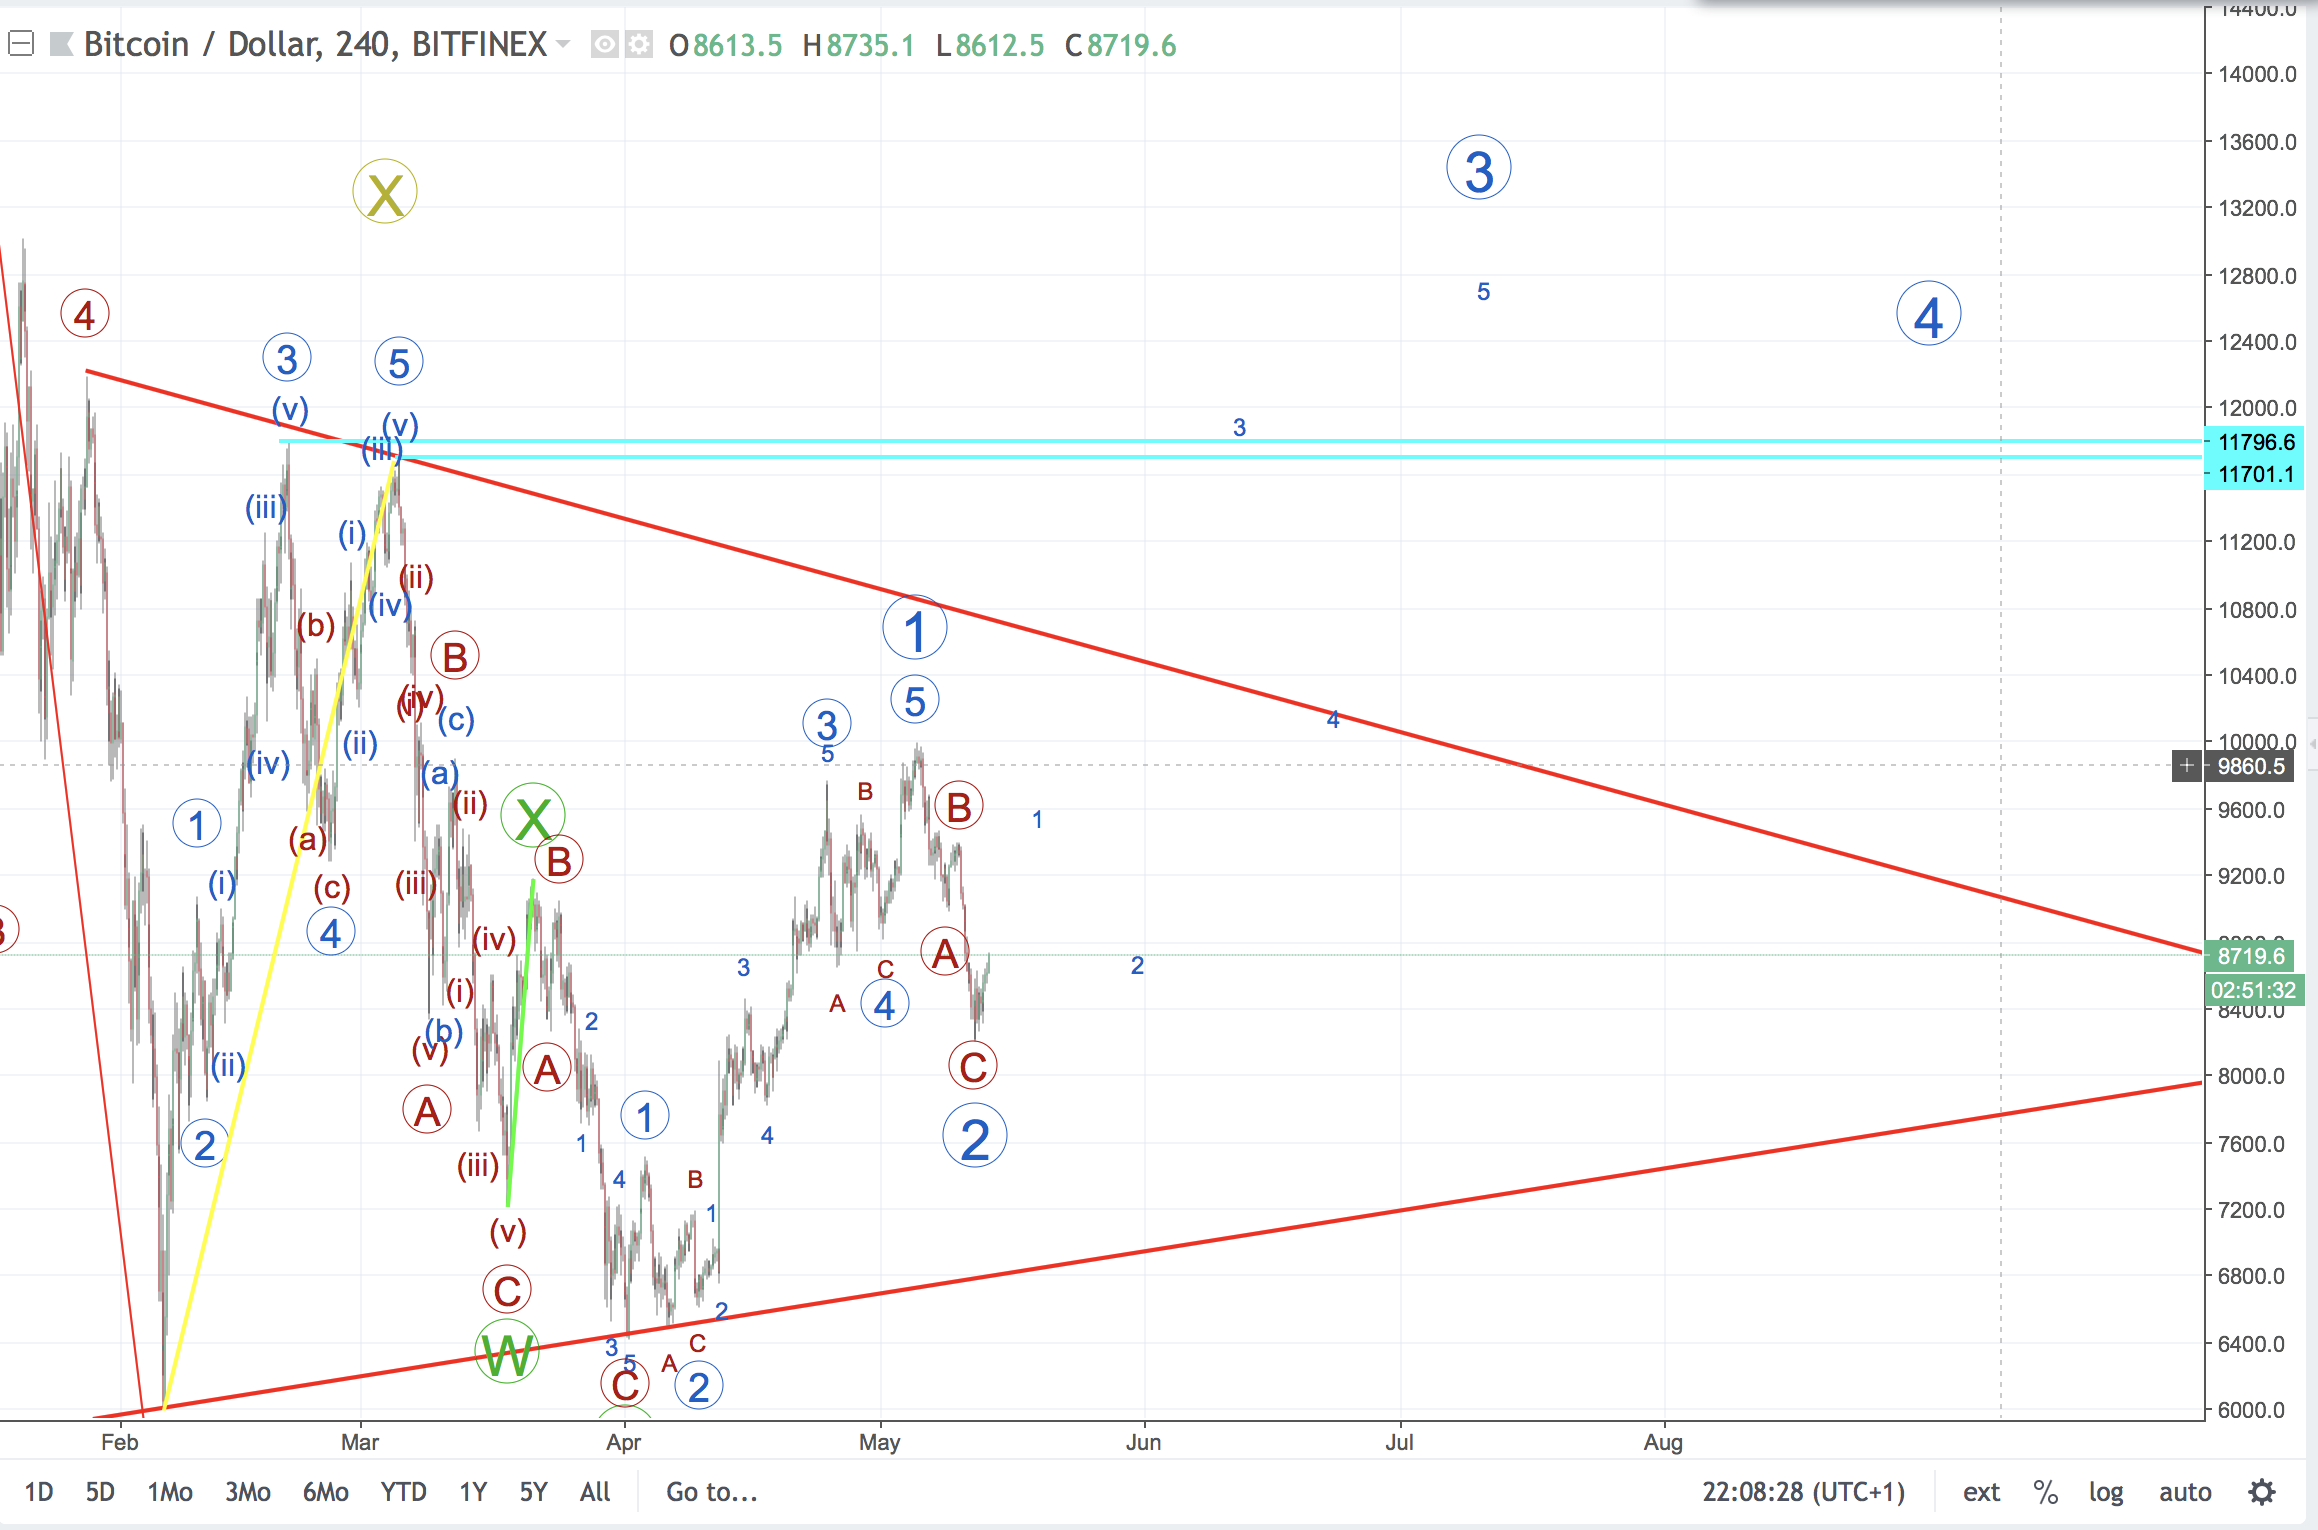
The picture below outlines the bullish count. It shows that we have already completed our first and second wave out of the motive wave.

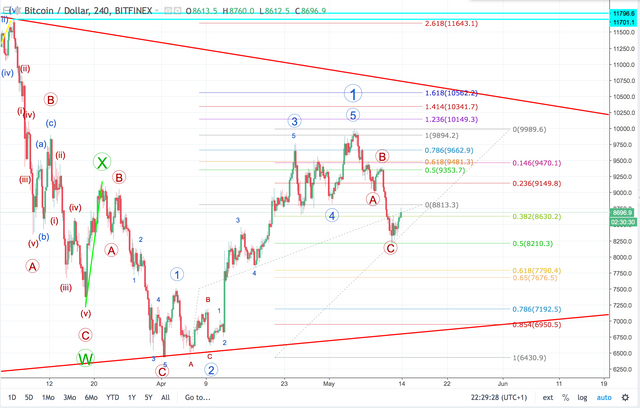
The next picture supports this view. Firstly, I drew a fib retracement from the bottom of the Y wave up to where the 5th wave ended. We can see that there was a perfect bounce off of the 0.5 fib level. Second wave retracements are usually deep and it would have been more reassuring if it bounced off of a lower fib level (such as the 0.786 or the 0.854). Secondly, I drew a fib extension of the first sub wave onto the fourth wave, we see the fifth wave ends at the 1:1 level.

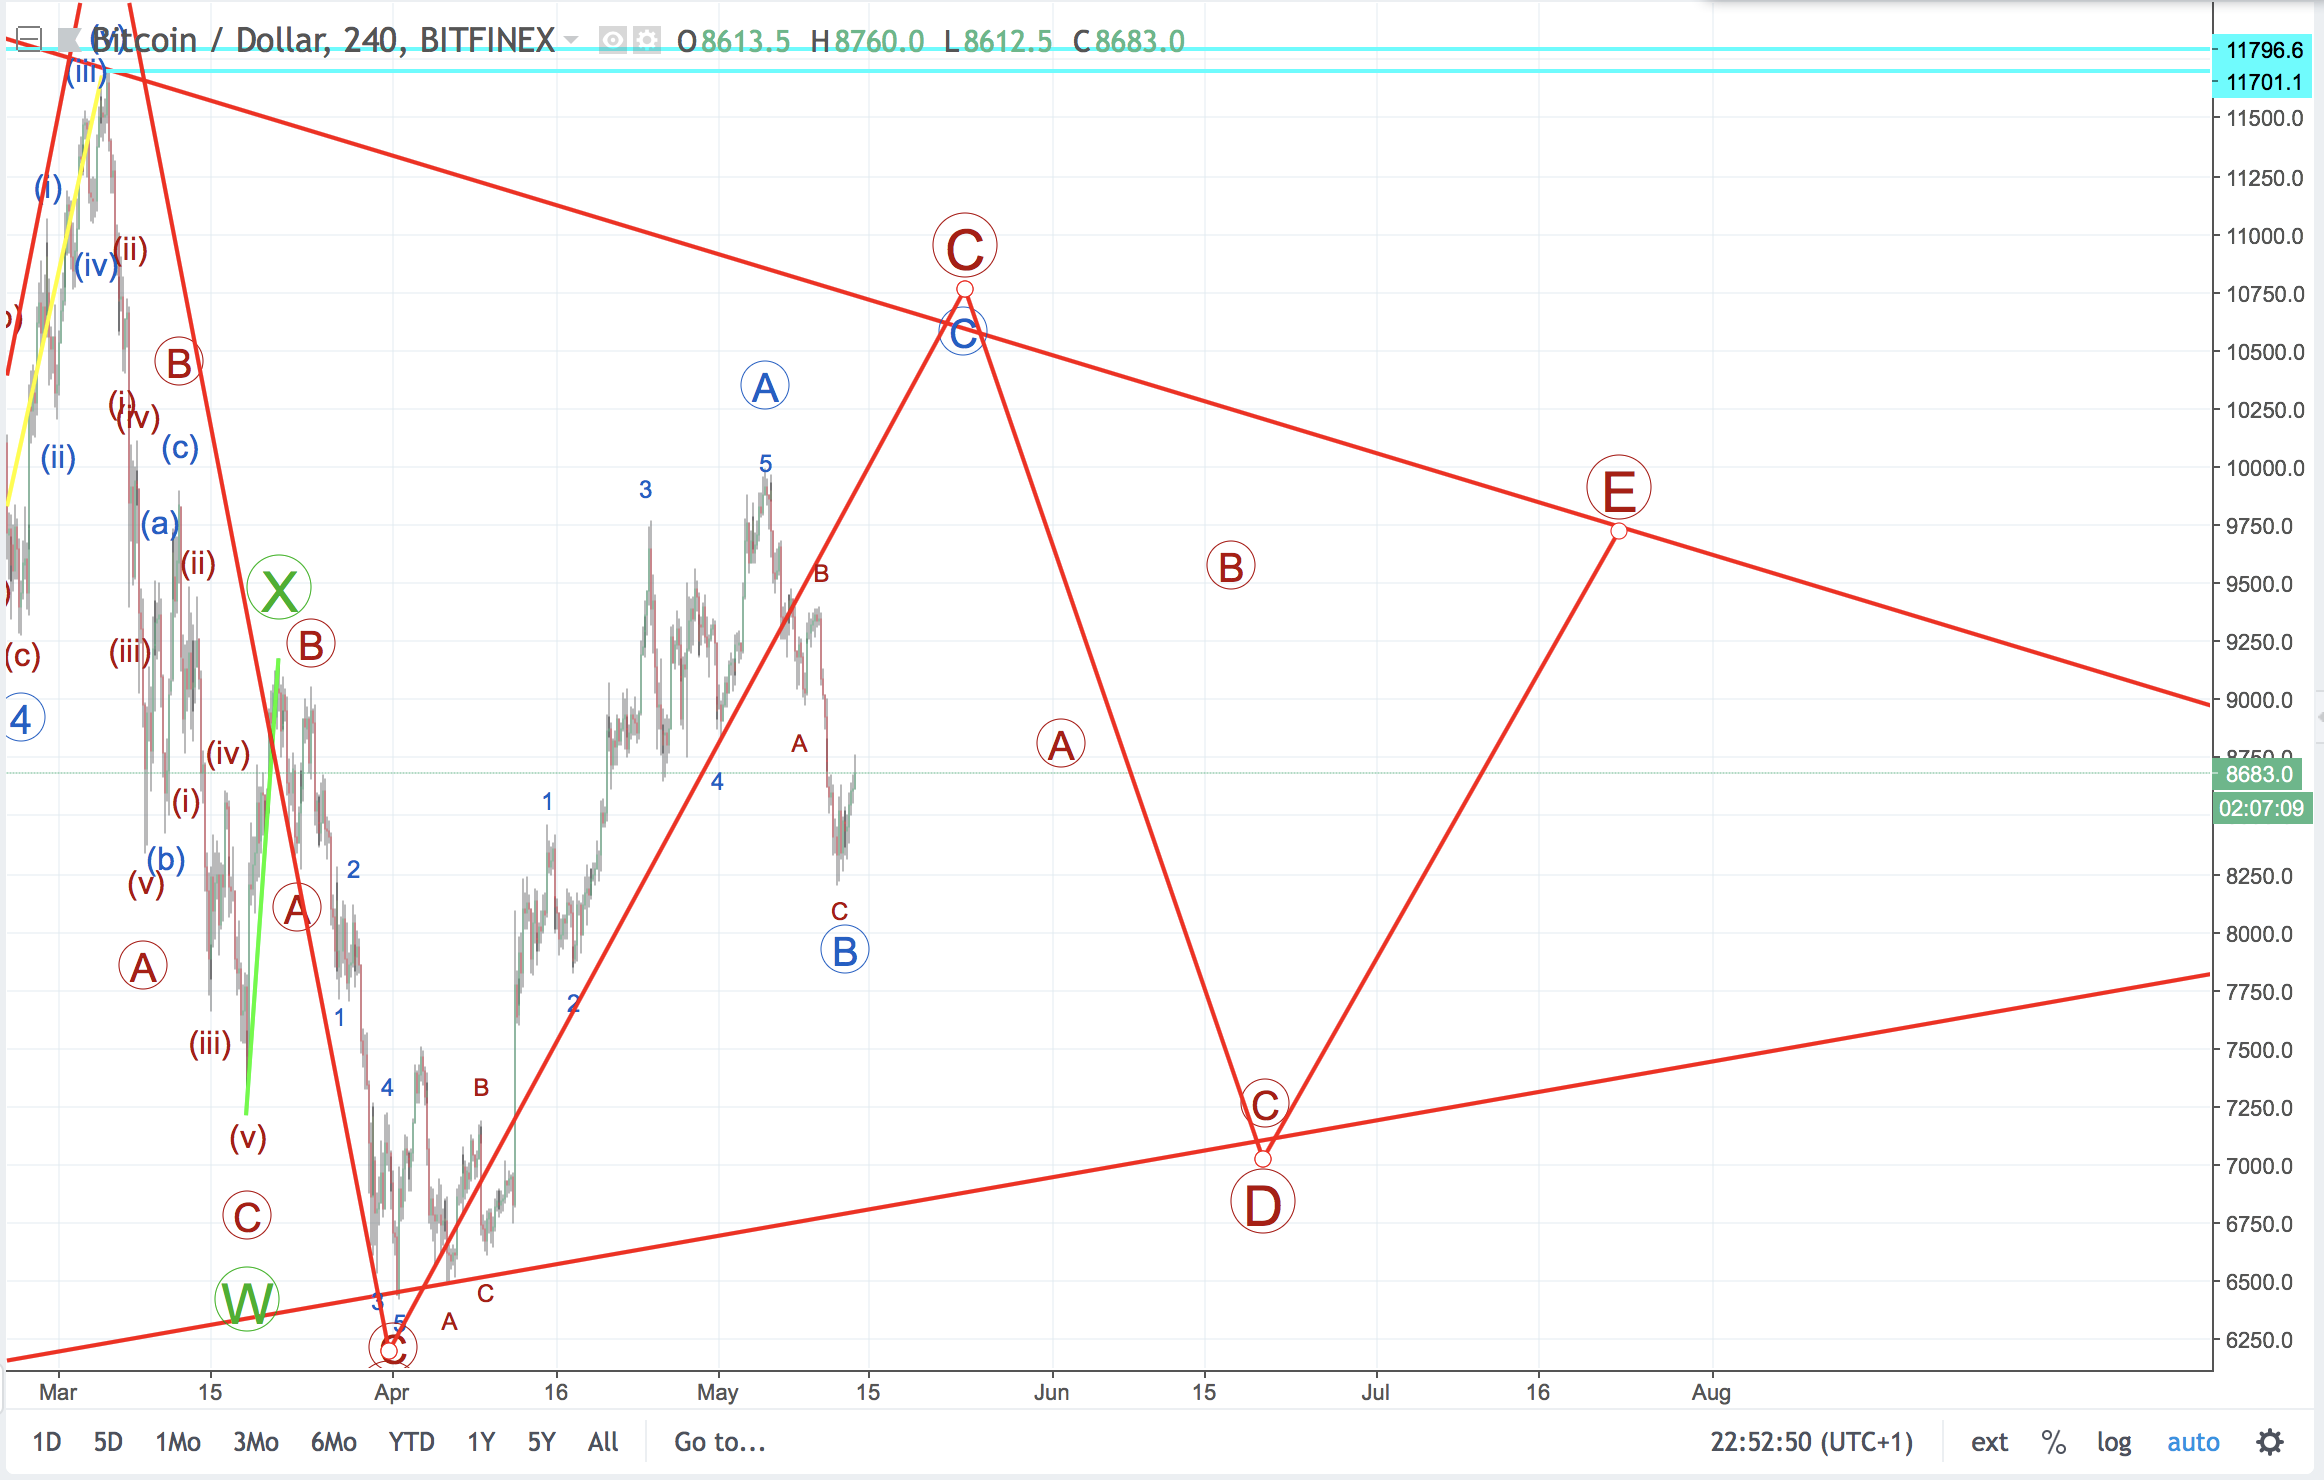
Next, the bearish view. The pic below supports the bearish outlook, we are now trading within a contracting wedge/triangle. It is a 5 wave structure (ABCDE) with 3-3-3-3-3 sub waves. This is a bearish shape, unless Bitcoin dramatically breaks out and pushes up above the red resistance line, a large drop normally occurs after the 5 waves are completed.

I personally think that Bitcoin still has some correcting to do, or at least a few months of accumulation before the next bull run.
Happy trading!
I quite like this scenario. BTC sideways until the last months of the year, losing market dominance during an altseason that is just starting. Then a massive BTC bull run, regaining it's dominance and bringing alts back down.
I also believe it needs to correct more after last year's crazy run.
Now what I like doesn't really matter, so let's see what happens 😀
Downvoting a post can decrease pending rewards and make it less visible. Common reasons:
Submit