BITCOIN ANALYSIS BETWEEN THE BULLISH AND BEARISH LINE AND AREAS:-
https://www.tradingview.com/chart/BTCUSD/u1IRcAtT-BITCOIN-DANCE-BETWEEN-THE-BULLISH-AND-BEARISH-AREAS/
Hello, my dear followers and the other crypto loves users
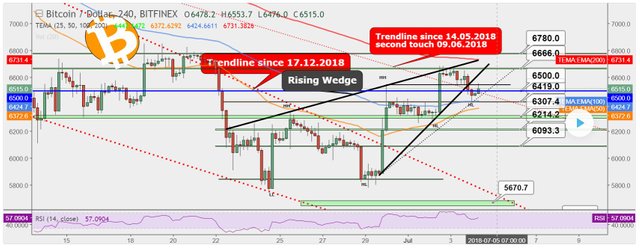
At the moment BTC 2.35%, shows us some bullish signs and some bearish signs and we step between those important levels.
Let's start from bearish signs:
- We had yesterday two types of "Rising Wedges" and also two types of "Bearish Flags" - we break all those patterns downwards
- We break back below the minor trendline since 14.05.2018
- We break down from the major continuation pattern "Rising Wedge"
- The trend is Your friend and the trend is down at the moment!
Now the bullish signs: - We have an uptrend since 24.06
- Yesterday's candle closes above the round number which is $6500
- The bounce comes from $6414 where met decent support/resistance area, Fibonacci retracement 62% and the bounce was supported also with EMA100
- Also, there was a possibility that this bounce from a new HL
- At the moment the price is back above the trendline and above the $6500
Summary:
At the moment there are mixed signs! IF the yesterday's candle would be closed below the $6500 then it would be also much easier! But this bounce and possible HL makes me a little bit cautious about shorting - need more criteria (like yesterday)!
But in the other hand, I just don't see the buyers power at the moment to push this price up and the zone where they have to push this through, this level is very strong!
Only long candles can beat this levels and where we get those candles - we get those candles then when we see a very big volume!
Wait for some updates and chart patterns from the lower timeframes!
Let's seek and FIND nice confirmation boxes where we can enter the trade!
Don't forget to LIKE, unless You don't appreciate it! ;)
Thank You very much!
5 Hours
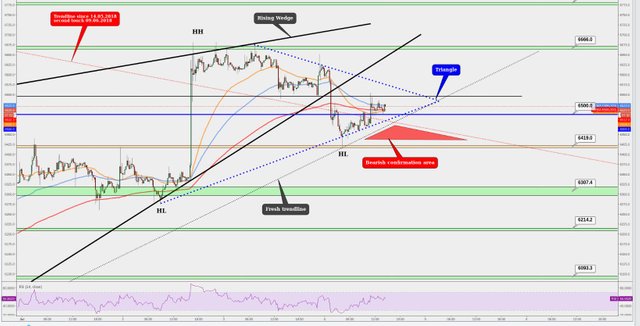
Comment: In 15 min. timeframe we could see there is forming a triangle pattern!
5 hours ago
Comment: In 15 min. timeframe we could see there is forming a triangle pattern!
I drew there also one red box - the bearish confirmation area and those criteria's are:
- Close below the round number $6500
- Close below the Triangle
- Close below the "Fresh trendline"
- Close below the trendline since 14.05 (red line)
At the moment the price bounced from support and in the 15 min.- chart the price is above the EMA's and let's see several hours we have some consistency from buyers so, they are here again, maybe starting to line up slowly ;)


✅ @bihar, I gave you an upvote on your post! Please give me a follow and I will give you a follow in return and possible future votes!
Thank you in advance!
Downvoting a post can decrease pending rewards and make it less visible. Common reasons:
Submit
Hi! I am a robot. I just upvoted you! I found similar content that readers might be interested in:
https://www.tradingview.com/chart/BTCUSD/u1IRcAtT-BITCOIN-DANCE-BETWEEN-THE-BULLISH-AND-BEARISH-AREAS/
Downvoting a post can decrease pending rewards and make it less visible. Common reasons:
Submit
Congratulations @bihar! You received a personal award!
You can view your badges on your Steem Board and compare to others on the Steem Ranking
Vote for @Steemitboard as a witness to get one more award and increased upvotes!
Downvoting a post can decrease pending rewards and make it less visible. Common reasons:
Submit