I've been promising an update to the long-term BTC chart since my BTC post of 10 January. Here it is.
The last time that I did a proper long-term look at BTC was when I looked tried matching the Fib levels of the 2014 bear market with those of the 2018 bear market, about 2.5 months ago.
For what it's worth i think that I did a fairly decent job in that post, concluding that:
- $6069 may be a realistic post-capitulation consolidation level .
- $3230 is a possible bottom for the 2018 bear market.
- $3206 is also a possible bottom for the 2018 bear market.So from a TA perspective the official Bit Brain answer to "How low will the market go?" is "just over $3200". But as I said yesterday, I still consider $3000 to be an psychological level and I expect many buy orders to be there. For that reason I am not dismissing it entirely. If "just over $3200" fails to stop the fall of BTC price, it should at least provide very serious support.
Which turned out to be fairly close to the bottom of around $3130 (at least on BitStamp - the exchange I used for that specific TA), so I was on track with the Fib levels I picked.
Today I am again looking at the 2018 bear market vs the 2014 bear market, specifically - I'll be looking at the 2018 bear market recovery by using the 2014 bear market recovery as a template. I did something similar during my posts about capitulation last month, but it's now time for a dedicated post on the topic.
The 2014 bear market was extremely severe and slightly longer than the 2018 one. A little scaling is in order to make them overlap better, but generally they are very similar in appearance. Because of that I can rest easy in my chair while you do all the work yourselves 😉, I'll just take care of the graphics side of things and let you draw your own conclusion from what I show you - they way that it should be.
I will be using two favourite tools of mine: the first one is the pattern repetition of the markets. While they will never perform exactly the same as before, markets will rhyme over and over again. That basic pattern repetition and predictability forms the basis of TA and the psychology of the herd mentality on which TA depends.
The second tool I will use is overlaying one market on another - an effective way to see how well they compare and what the future may hold.
Let's get straight to the charts:
The Charts:
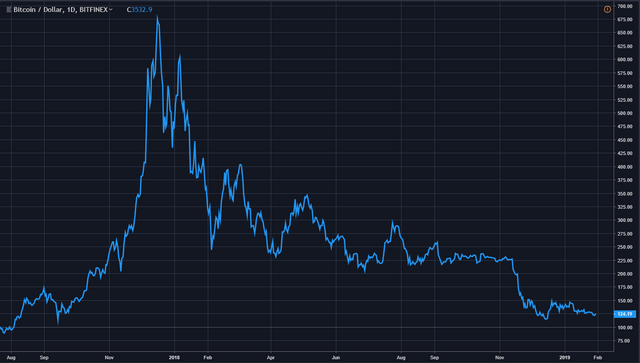
This is the 2018 bear market:
It includes late 2017 as well as January 2019.
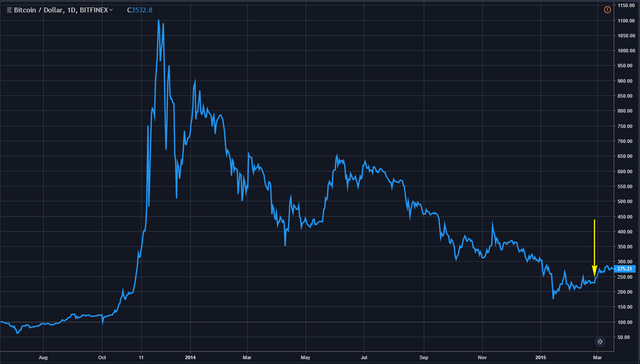
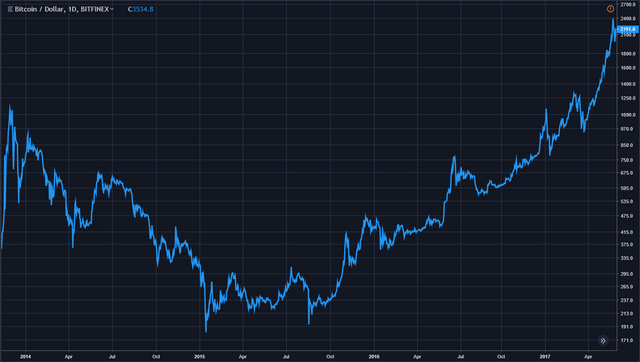
It is the eerily similar 2014 bear market:
The arrow depicts the rough position of where the 2018/2019 market is in this cycle.
Which is positive news because...
After a period of further consolidation and largely sideways movement, the 2014 market took off after this point. This consolidation happened over a period of nine months in 2015. Scaled to the 2018/2019 market, that time frame would realistically be approximately eight months long. While I have been expecting a Q2 2019 recovery, I must be honest and share the facts as the charts give them to me. According to this predicted time scale, the bulls should return in September of 2019.
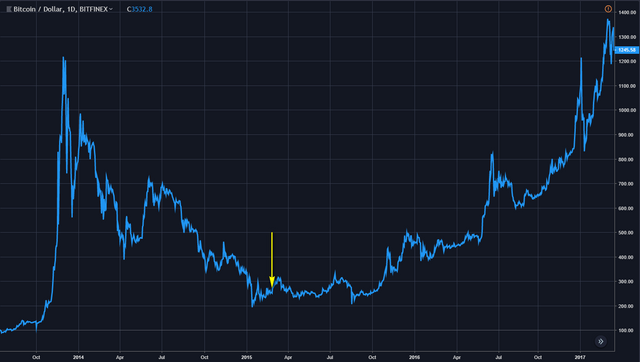
So if I take our current BTC chart here:
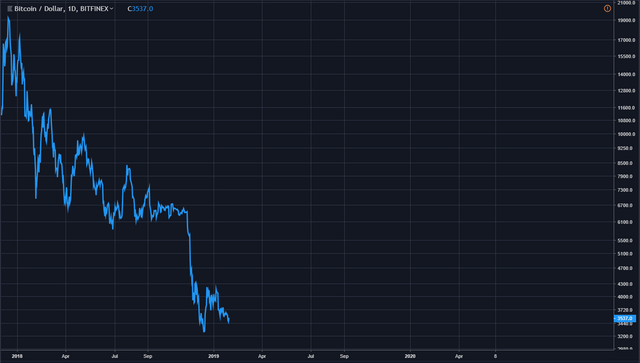
...and I superimpose this 2014/2015 chart upon it...
I get an overlay which looks like this:
(Red data is the 2014/2015 data. Scaling is what I consider to be the best fit)
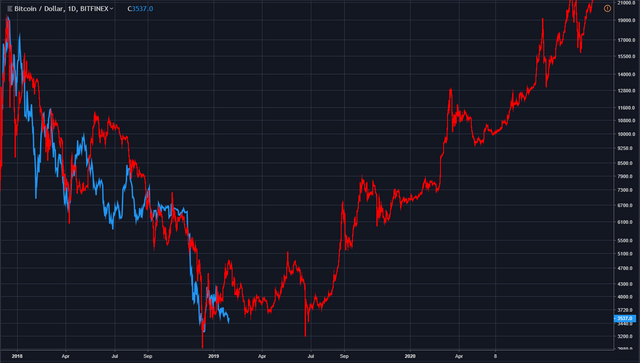
This is the part where you must start to really draw your own conclusions. Either I have just showed you two very similar markets, one of which predicts the future of the other - or - I have superimposed unrelated market data and the idea that market cycles repeat is wrong. That conclusion is yours to make.
I'm not quite done yet, I can do something similar using a simple coinmarketcap chart. I'm using Total Market Cap here to show that the result is similar to that of BTC alone:
Below is the entire cryptocurrency market history as seen on coinmarketcap.com. I now take the section in the rectangle, scale it to fit, and paste it over the current market - starting at the December 2017 peak and letting it run on into the future as a repetition-based prediction:
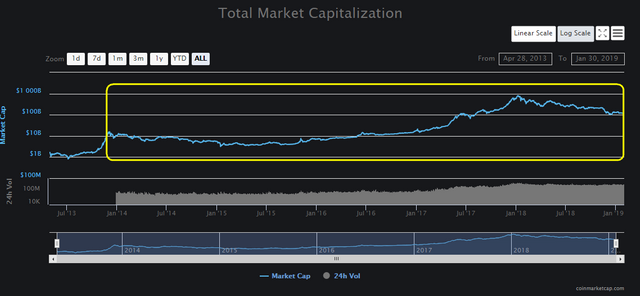 From coinmarketcap.com/charts/; modified by Bit Brain
 From coinmarketcap.com/charts/; modified by Bit Brain
By now I trust you have drawn some of your own conclusions. But a long-term BTC price post by Bit Brain would not be complete without looking at one final chart - the one where I connect the peaks of the two major bull runs (in green) and draw parallel lines at the start and end of the 2015 capitulation event (in red) to show where the price turns.

We are on that turning line now. If you can accept that a hard capitulation does not need to happen and that we can have a soft one as described under the heading "Capitulation already happened and most people missed it" in this post - then you can see why I have been saying in my last few BTC posts that the long-term chart is supporting positive price movements in the very near future. Even if we do still get a hard capitulation event, we can still expect the market to begin to consolidate for the next bull run very shortly.
Conclusion:
Nothing here is set in stone, but I will say this much: the longer-term the chart/pattern, the more reliable it is.
I think that BTC is ready to turn. I think that capitulation has already occurred, though I do remain ever wary of a dead cat bounce - better safe than sorry.
I'm expecting more sideways movement now. There will be lots of ups and downs for the next few months - standby for an emotional roller-coaster of false hope and frustrations! But one day we will finally get to that next up which will just keep upping. Whether that will be in Q2 as I hope, Q3 as these charts tell us or perhaps only in the distant future remains to be seen. One thing remains certain - I am fully confident that the crypto bulls will be back in force - whenever that may be - and that will have a profound and lasting impact on international finance!
Yours in long-term crypto
Bit Brain

"The secret to success: find out where people are going and get there first"
~ Mark Twain
"By this means (fractional reserve banking) government may secretly and unobserved, confiscate the wealth of the people, and not one man in a million will detect the theft."
~ John Maynard Keynes

Bit Brain recommends:
Crypto Exchanges:


 ---
---
Published by BitBrain
on


Excellent!
By the way, you can find the total crypto market in- and excluding btc when you search for 'total' in the index section within tradingview. No need to copy from coinmarketcap. Just in case you didn't know. It took me a while to find it.
Downvoting a post can decrease pending rewards and make it less visible. Common reasons:
Submit
I did not know that. Thank you!
Downvoting a post can decrease pending rewards and make it less visible. Common reasons:
Submit
It is pretty interesting to see your analysis and hope in the second quarter Bitcoin will move back from the dead. I hope we hit the floor and the capitulation phase is almost over!
Downvoting a post can decrease pending rewards and make it less visible. Common reasons:
Submit
I've just looked at it again (from another perspective) and I truly believe that chances are very high that the nightmare is almost over.
Downvoting a post can decrease pending rewards and make it less visible. Common reasons:
Submit
I believe in crypto and this is a reason I don't give up from this space!
Downvoting a post can decrease pending rewards and make it less visible. Common reasons:
Submit
My sentiments exactly! It's now just a question of patience.
Downvoting a post can decrease pending rewards and make it less visible. Common reasons:
Submit
I am feeling that it is a possibility that we are near a bottom which has had me to consider buying with a dollar cost average strategy for the next few months!
Posted using Partiko iOS
Downvoting a post can decrease pending rewards and make it less visible. Common reasons:
Submit
If I had fiat right now I would definitely be value costing in. I'm hoping for a fiat payout soon, if it does come I will definitely be putting some into crypto!
Downvoting a post can decrease pending rewards and make it less visible. Common reasons:
Submit
Great! I read something similar around ;-)
Downvoting a post can decrease pending rewards and make it less visible. Common reasons:
Submit
At least if I'm wrong about all this I won't be alone! 😂
But take heart, I'm only wrong when my wife tells me I'm wrong, she seldom mentions BTC.
Downvoting a post can decrease pending rewards and make it less visible. Common reasons:
Submit
Very interesting post - in general I see no reason to reject the process. My own analysis sees BTC rallying 2nd-3rd quarter as certain key fundamentals should start being priced in around then.
Downvoting a post can decrease pending rewards and make it less visible. Common reasons:
Submit
There are many ways to skin a cat. I think it's significant that we follow different processes yet reach the same conclusion - it lends weight to our analyses.
Downvoting a post can decrease pending rewards and make it less visible. Common reasons:
Submit
Hey bitbrain, i have a shorterm target of 4100 target in mind. Nice to your view, thanks!
Downvoting a post can decrease pending rewards and make it less visible. Common reasons:
Submit
Have a look at my more short-term recent BTC posts. If there is a bull flag then you should easily hit that target and more. If there is no bull flag then I can't really say. I don't have a chart with any solid short-term Fib levels at the moment, I'm waiting for this possible bull flag to play out before I make further short-term calls.
Downvoting a post can decrease pending rewards and make it less visible. Common reasons:
Submit
Yeah, I know - I messed up the date in the title. Too bad - it's a long-term post so it doesn't matter. That's what happens when you don't realise that midnight has ticked by!
Downvoting a post can decrease pending rewards and make it less visible. Common reasons:
Submit