NOTE ABOUT BLOG
The blog is still in it's infancy and I ask that you guys give me feedback on analysts being reviewed, layout etc. I've removed "The Moon" and "Coin Mastery" as analysts. In my experience (following both of them for quite a while now), they're more geared towards macro trends in the BTC Market, which is not the main focus of the blog. We try and do the heavy lifting for you guys, to give you a concise systematic DAILY TA ANLAYSIS of the BTC market. You can find "The Moon" and "Coin Mastery" on Youtube, for those still interested in following them.


JD Marshall
Type of Trader: Medium/Long Term Trader
[Macro argument is that BTC is consolodating at these levels and building steam for higher highs in the FUTURE is still his macro perspective. In his opinion we're not seeing BTC reaching all time high any time soon. BTC next big resistance is the top of $9990. Since Feb. BTC's seen 3 major bottoms around the 6k-7k level. Which is an indication of forming higher lows and confirms a macro bullish trend (Green Line on Chart). Patience will be the key word for medium/long term investors in the BTC Market]
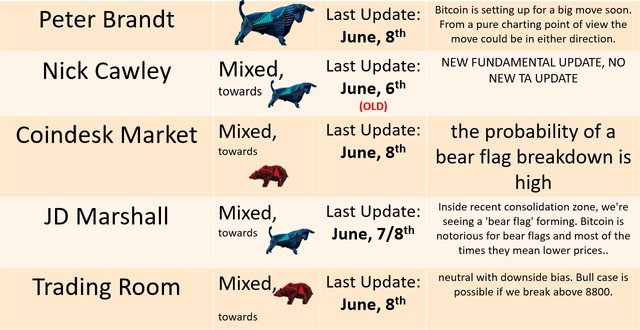
Inside recent consolidation zone, we're seeing a 'bear flag' forming. Bitcoin is notorious for bear flags and most of the times they mean lower prices.

If the price break up, it'll need to break the resistance levels at $8600 and $8800. If a bullish pop does occur, Marshall does not envision BTC having enough energy to break the recent top of $9990. Expect more sideways movement in BTC in the near to medium term.

@chartguys
Type of Trader: Short Term Trader
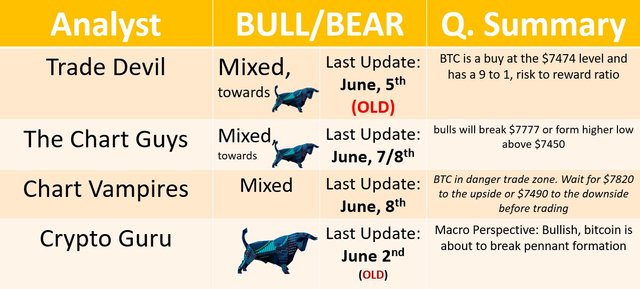
Very silent Thursday/Friday in the BTC market. On the daily time frame we have a scenario where the bulls will break $7777 forming a higher high (in the short term) and breaking the DAILY MA resistances, or reject from this level and form a higher low above $7355. Both scenarios are favorable to the bulls.
@tradedevil (NO NEW UPDATE)
Type of Trader: Short Term Trader/ Day Trader / E.W. Analyst
chris L $ChartVampire$
Type of Trader: Short Term Trader/ Day Trader
Chris posted the following warning relating to BTC's chart (See chart below for more in depth detail).
Warning ⚠️⚠️⚠️⚠️⚠️ this is a very dangerous trading in this range it is best to wait for the breakout of the 50 MA on the up side or the 30 MA on the downside to trade safely.
Peter Brandt
Type of Trader: Short/Medium Term Trader
Bitcoin is setting up for a big move soon. From a pure charting point of view the move could be in either direction. In fact, the burden of truth is on the bulls.

Nick Cawley (NO NEW UPDATE)
Type of Trader: Long Term Trader/Investor
(NEW FUNDAMENTALS ANALYSIS)
A look at Google analytics show that searches for Bitcoin (BTC), Ether (ETH), Ripple (XRP) and a range of other cryptocurrencies have fallen dramatically after the market slumped at the start of the 2018. While investor interest has fallen, the number of net-long retail customers remains near to all-time high levels, suggesting investors continue to hold positions despite lower prices. The Google trend data may suggest that investors looking for quick returns have moved on and that going forward the market will continue to mature. Recent trading ranges give credence to this with support levels holding, allowing the market to push gently higher.
GOOGLE TRENDS - BITCOIN

Trading Room
Type of Trader: Short Term Trader
Bitcoin has broken below key Moving Averages in Weekly & Monthly Time frames. We're neutral with downside bias. Bullcase is possible if we break above 8800. Bear Case below 6950 now. Expect boring price action until break.

Crypto Guru (NO NEW UPDATE)
Type of Trader: Short Term Trader
Mini Falling Wedge (teal) within a Massive Wedge (yellow). We faced the same exact situation at the start of Feb & April; except this time he believe we're ready to break through the Massive Yellow Wedge.

Coindesk Markets
Type of Trader: Short Term Trader
The probability of a bear flag breakdown is high as BTC bulls have failed to capitalize on the upside break of the falling channel. Bulls need a quick break above $7,780.

BTC is breaking lower. The flag support is seen around $7,520.

Mr. Swing Trade (24 hours old)
Type of Trader: Short Term Trader / Swing Trader
1)If he is to remain bullish, these are the zones he would keep an eye out to go long for intraday trading between the swing-low and swing-high pivot points.
- The highlighted ares in green is possible entry points between $7200-$7450 (on chart).

Also, a shout out to @famunger for his daily Analyst Summaries.
Many thanks for the summaries!
Now that two analysts are gone you may want to consider lordoftruth and ew-paterns, both active on SteemIt
Downvoting a post can decrease pending rewards and make it less visible. Common reasons:
Submit
Hi @hoppe. Thank you for the suggestions. I follow @lordoftruth and @ew-and-patterns and enjoy their work, but I don't want to add their TA's to the summary, as @famunger is already covering their views in his summaries. I'm the new kid on the block, while @famunger has been doing this for quite a while. I want to honor @famunger and not cover the same people. If you have any other suggestions of analysts that you would like me to add to the summary, please feel free to let me know. I hope you find the summaries meaningful. Thank you for your input, I appreciate it. Cheers
Downvoting a post can decrease pending rewards and make it less visible. Common reasons:
Submit