Is The Bottom In?
The obvious question in crypto at the moment is, are we continuing the crypto bear market down to set new lows or is this just a simple pullback before we make another attempt up to the all important 11k price level on BTC?
Currently my systems have us long BTC and holding. However the newer more agile system, which has been more successful in 2018 playing the downside and except for catching the April lows at $6819 had been stopped out of all long trades...got short at $9339. This triggered a little profit taking but the long BTC trade is still on, for now.
Warning - This is not going to be a decisive discussion about exactly what I KNOW to happen with complete certainty. I am right about 70% of the time, and when I'm right, I'm right in a big way. When I'm wrong my losses are much smaller. This is how I've been able to be a trader for nearly 20 years now.
We will discover a number of different ideas I have as to when BTC will find support, if it does, and what the future MIGHT look like.
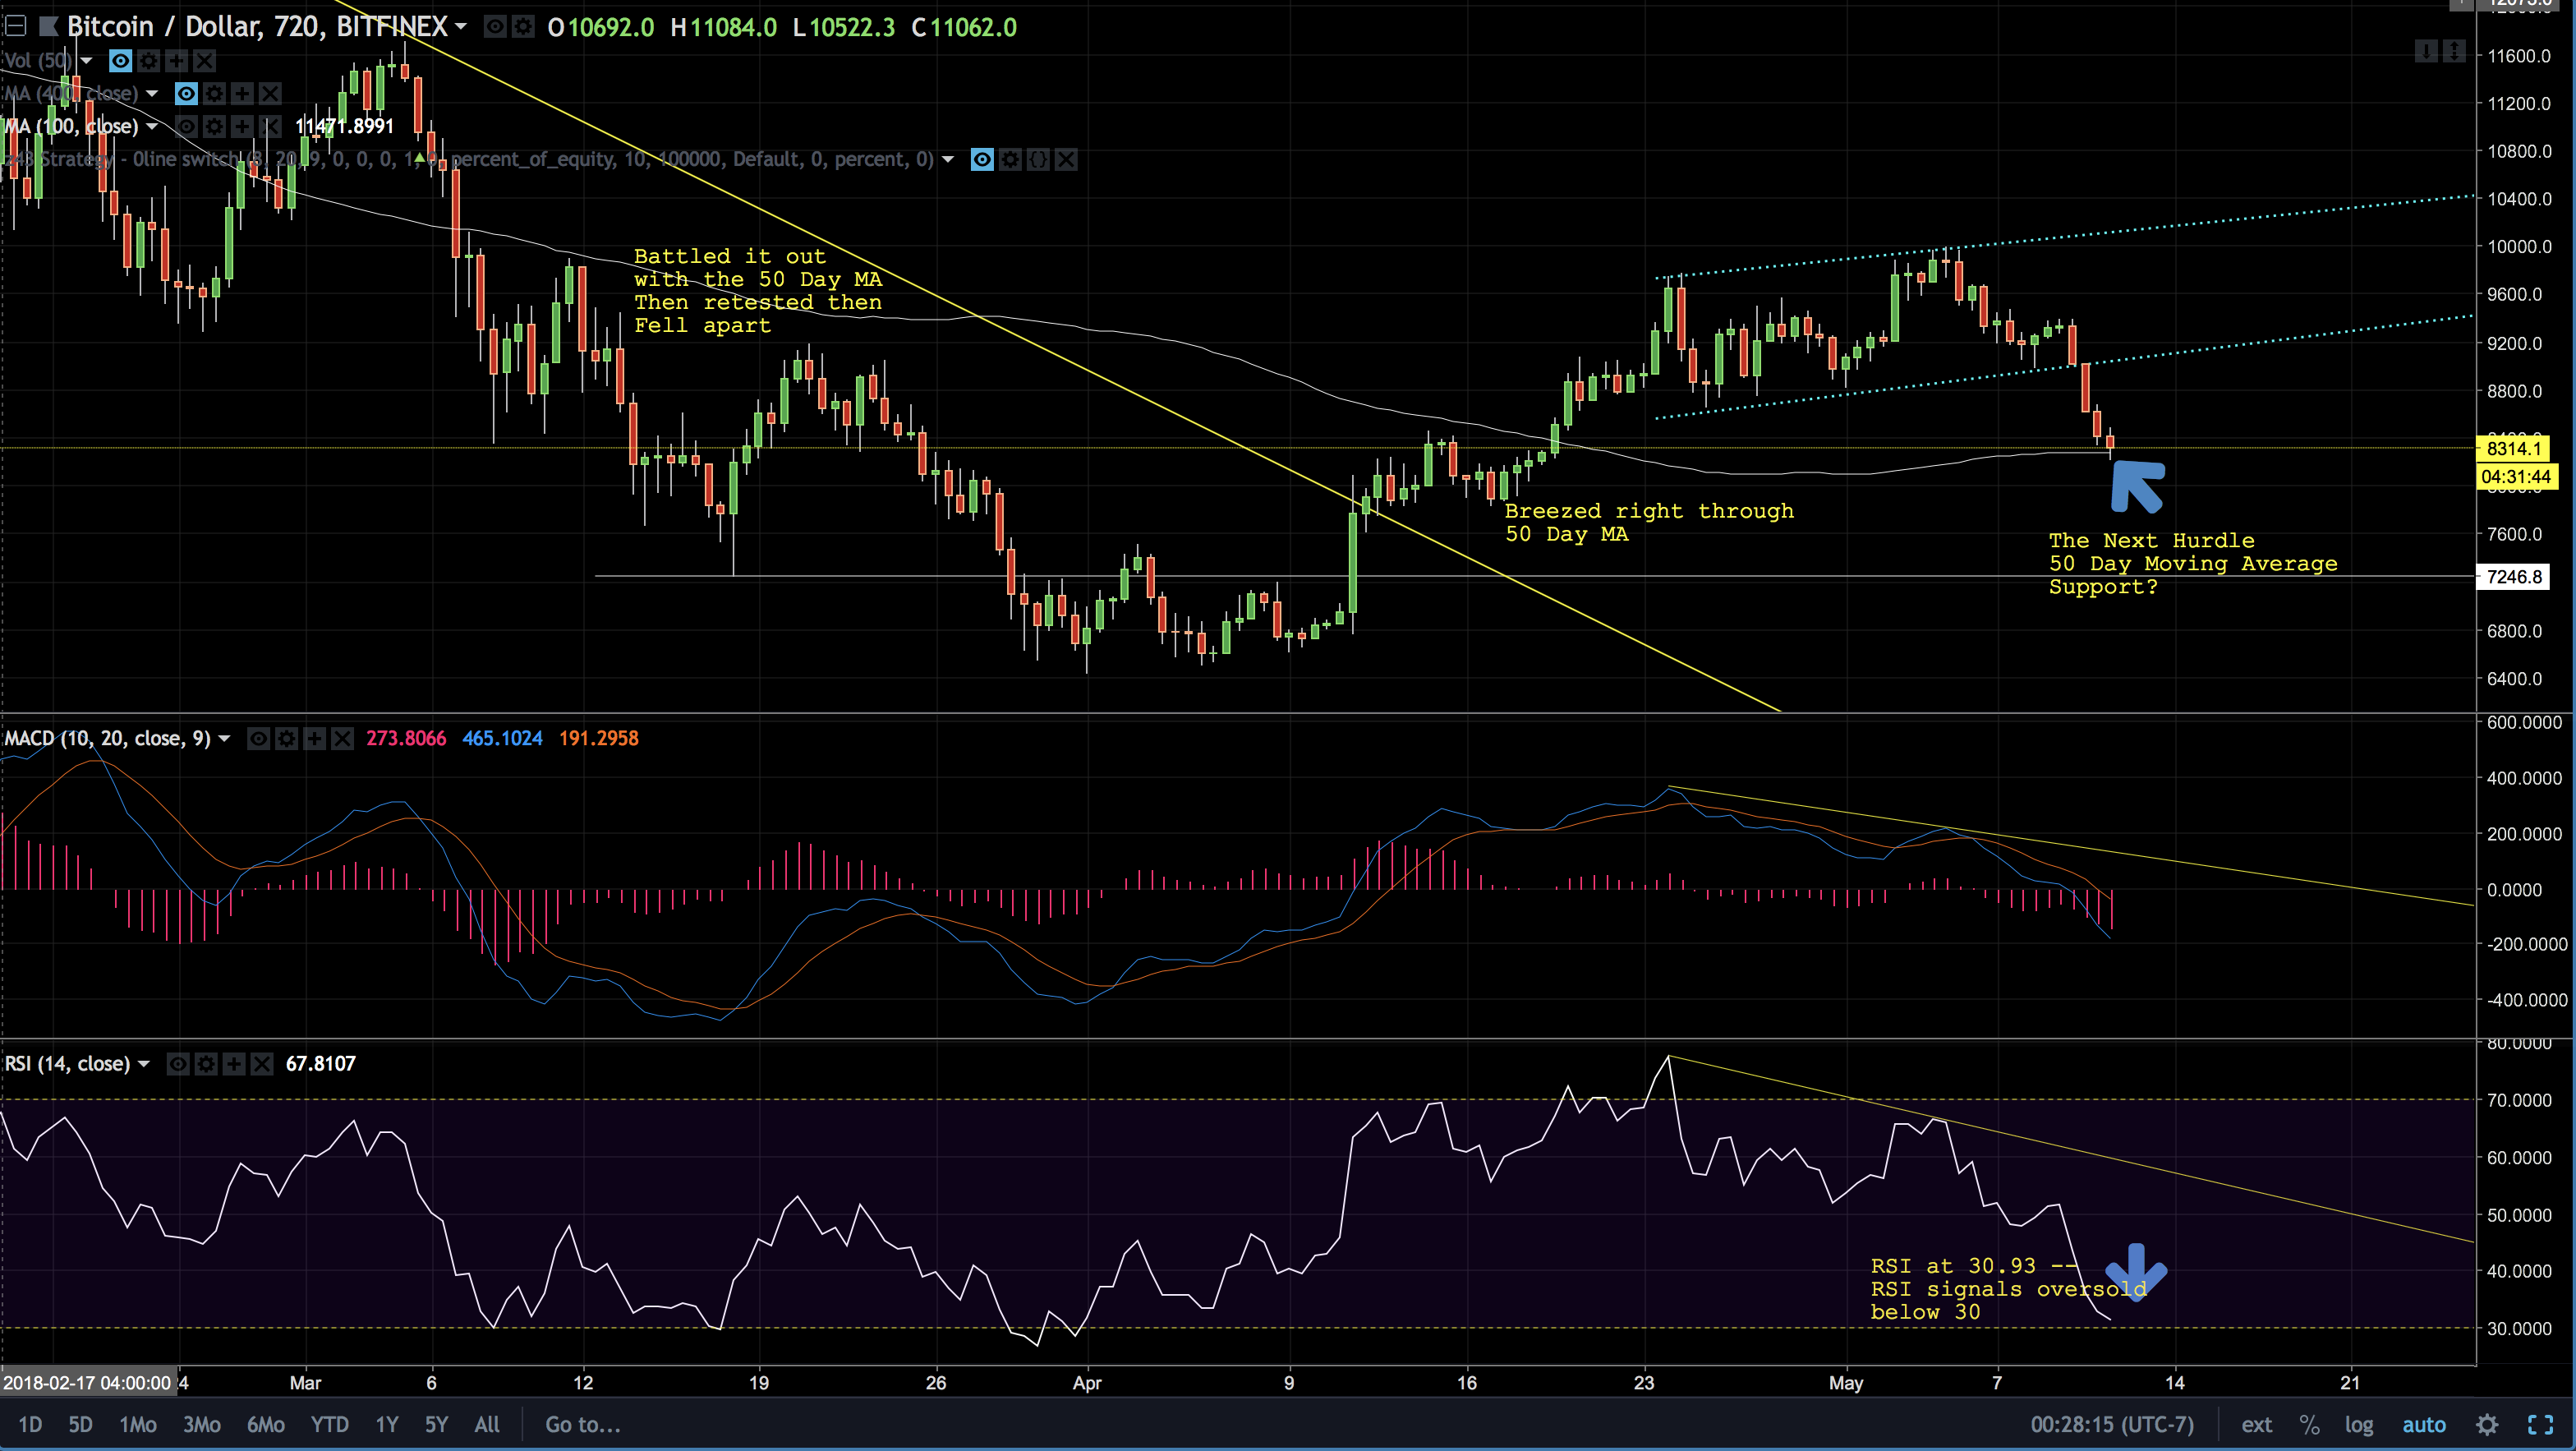
The 50 Day Moving Average
Remember how quickly we moved above the 50 day moving average back in April?

I don't really use the 50 day moving average for my systems, BUUUUUUT a lot of people do. So the Twitters and paid groups will be full of people calling the 50 day MA the support, and if we hold here, we are still in a bullish upward trend. A lot of people will be jumping in here to buy at the 50 day.
Additionally a lot of system traders use the 50 day moving average as a signal to be long or short biased or just exit the market and wait until it moves above again.
There's a lot of hoopla with the 50 day moving average, and yes it certainly could be a self fulfilling situation where enough people believe it and trade off it that it just happens to work out.
For my analysis, it's mildly entertaining to note, but only a data point.
When things are getting dramatic I prefer to move to a higher time frame, let's have a peak at the 3 Day chart, where each candle is 3 full 24 hour trading days.

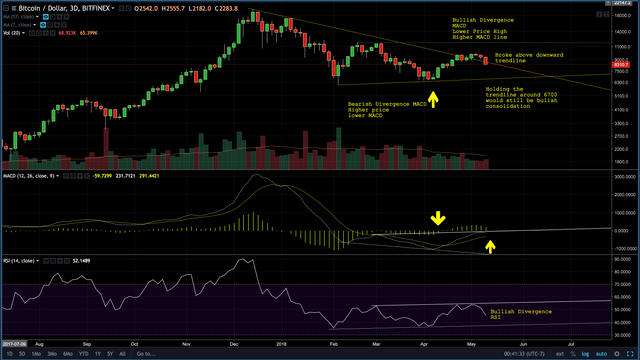
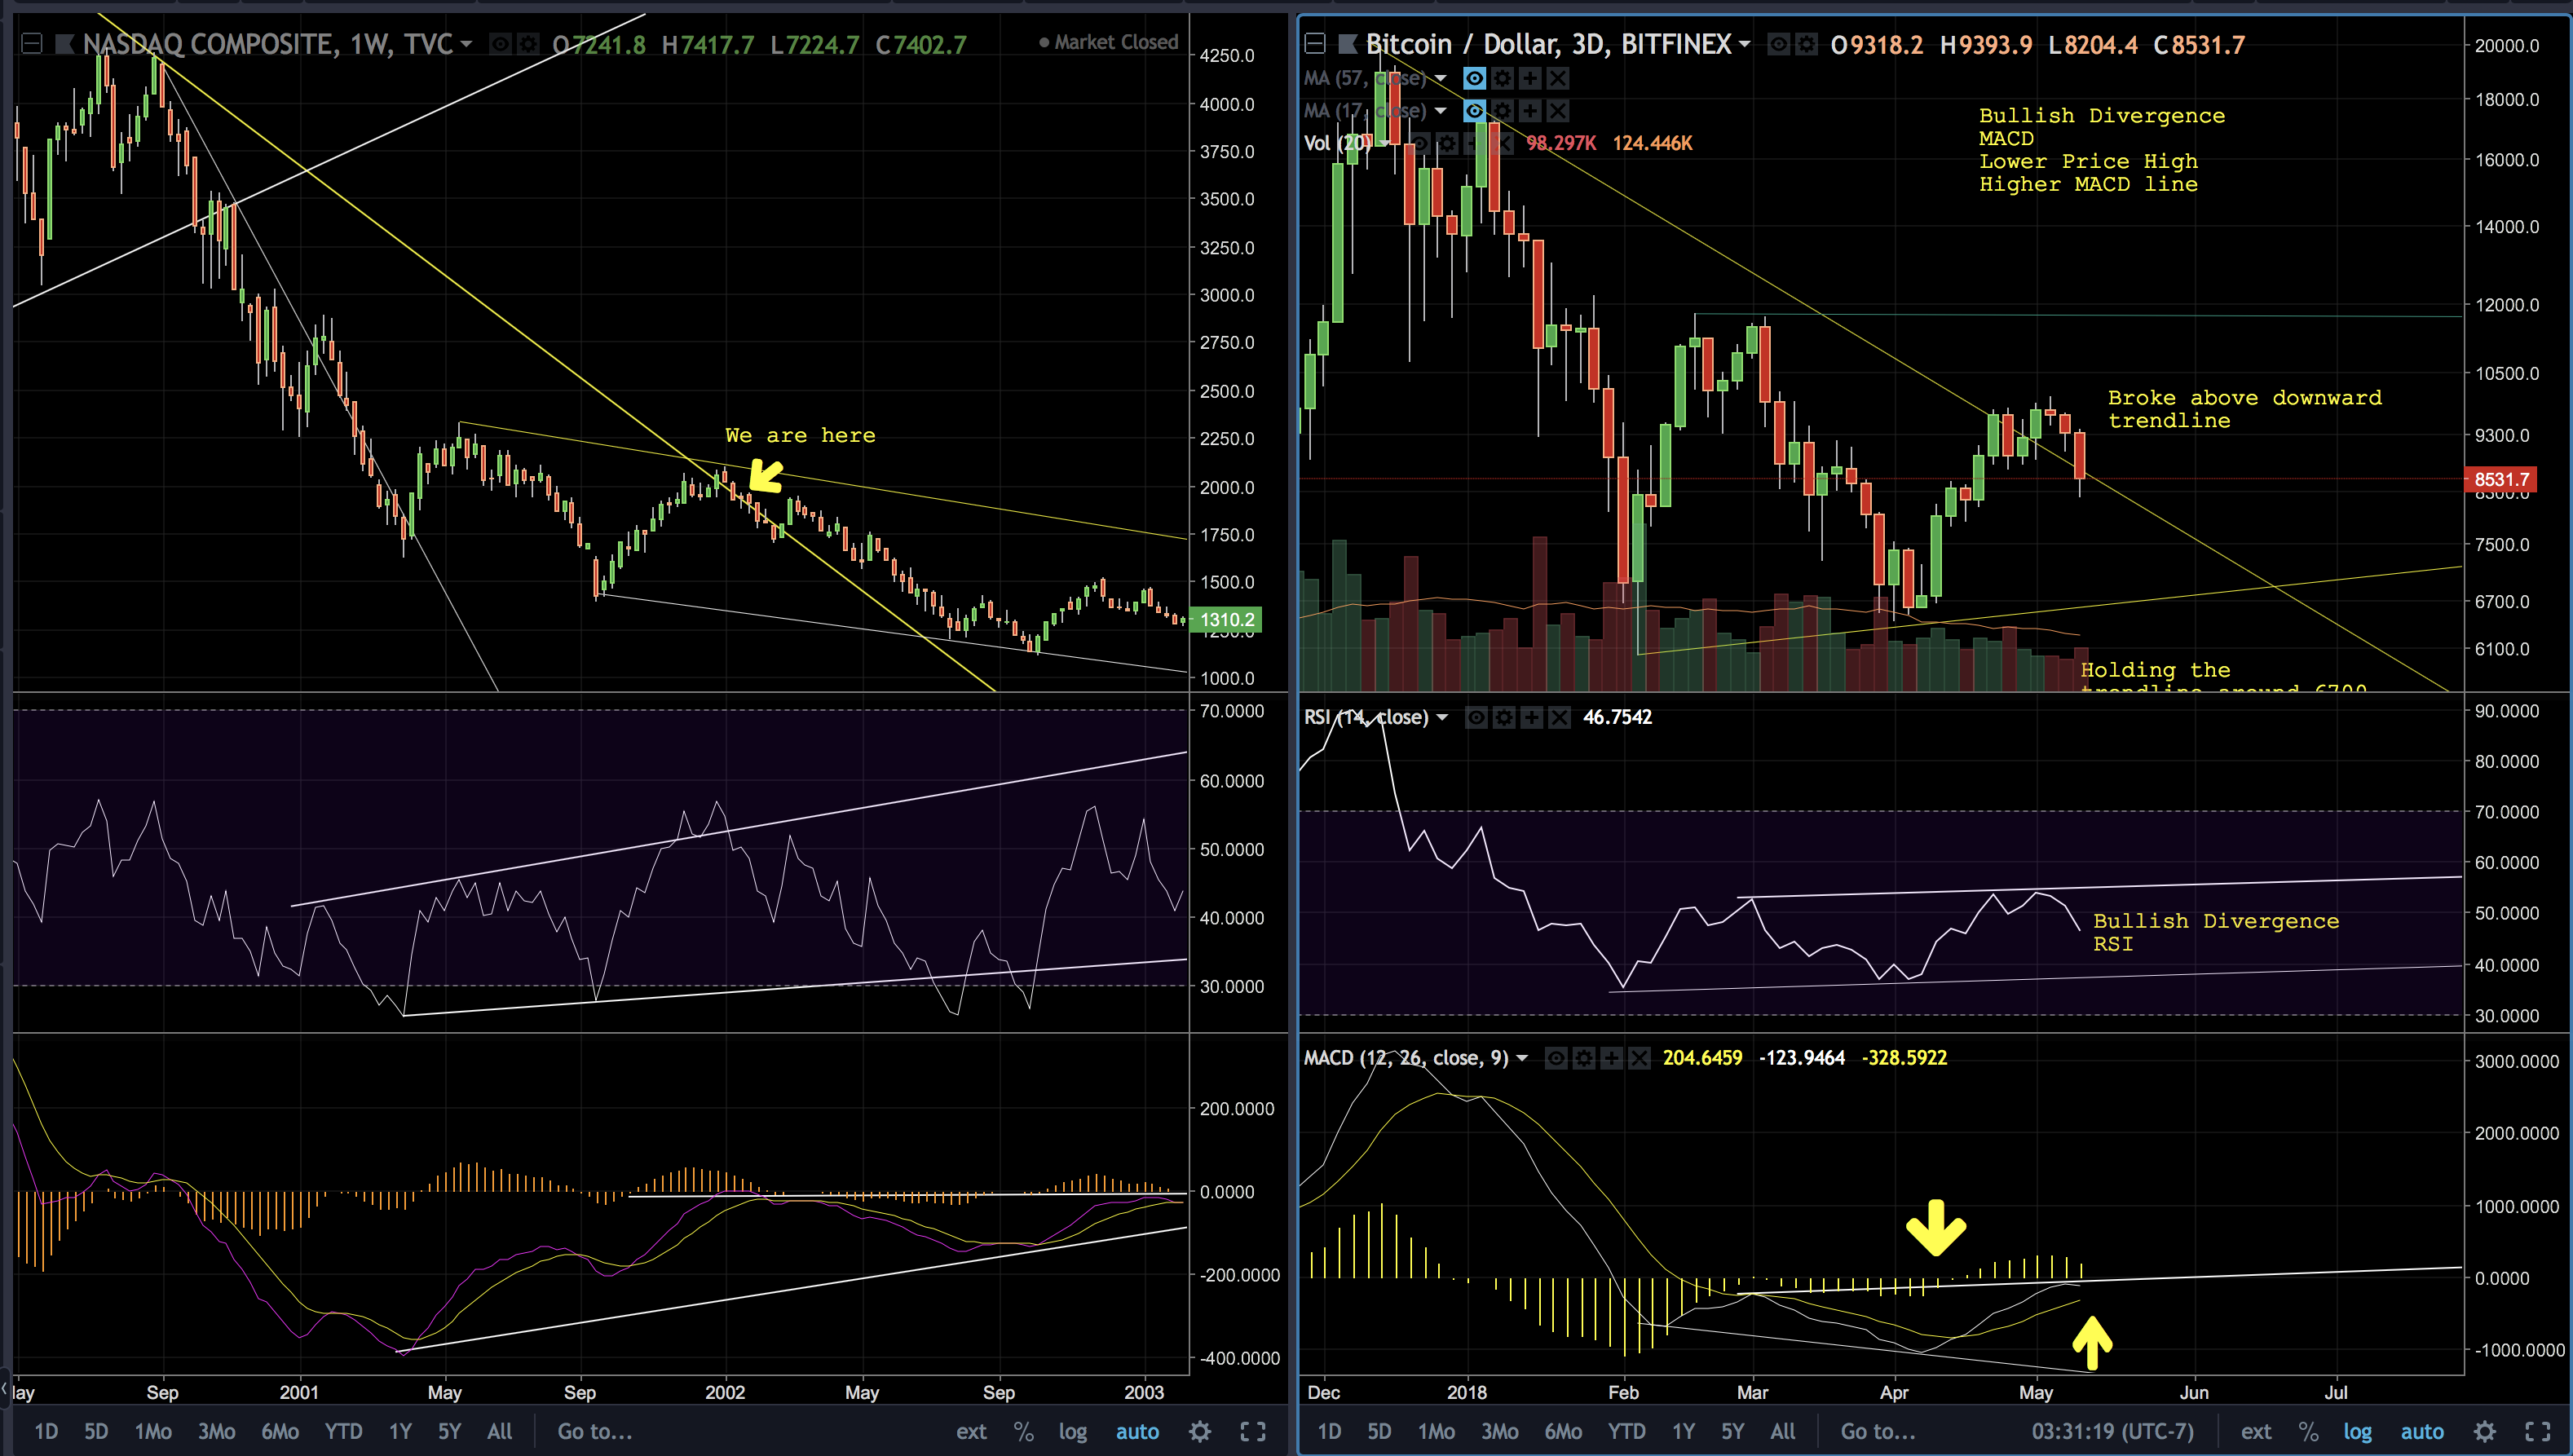
When finding bottoms I put a lot of weight in bullish divergences with the MACD and RSI. When we bottomed out in April we had just put in a higher low on price, but MACD had put in a lower low. That is a big red flag and signals that sure we may be bouncing but we are not exiting the bear market. The RSI, however did put in a higher low confirming the bottoming action and really giving a boost to get prices back up to the 10k levels.
The MACD was still cautions, hesitant to support this bottoming theory, until we move to higher swing highs on from our first swing up to the 11,00 level followed by the dramatic pullback down to 6400 theme back up to the swing high at 9900...BOOM A lower high on price but more importantly a higher high on the MACD.
It gets a little messy to explain but put more simply, a bullish divergence on MACD is when the MACD puts in a higher high than it's previous swing high, while price doesn't put in a higher high. This is a juicy setup an exactly the price action you want in a long term bottom.
Analog BTC 2018 NASDAQ 2000
Yes I do see the same pattern in BTC and the Nasdaq Index of 1999/2000. Both had parabolic run ups, both were new technologies that promise the change the world had dramatic, both were very hyped, and most recently both had Warren Buffet calling them bad names!
The NASDAQ in the late 1990's was in a tremendous tech bubble, eventually hitting a high of $5,000 on the index. From there the index grinded lower for the next 6 years before starting to head higher. From the highs of March 2000, it took 17 years to regain those high prices again.
The initial shock came rather quickly, hitting new all time highs week after week. CNBC was running Nasdaq 2,000 specials, then 3,000 then 4,000 then of course you guessed it the 5,000 special. Within a matter of weeks after hitting the all time highs around 5,000 it was trading at 3,200. It wasn't until 2002 before a bottom was put in, but not after a couple years of slow grinding selloffs with dramatic bull traps that everyone was extremely excited for, before the price bottomed in 2002, a full two years later.
The interesting thing is, the exact chart patterns are playing out for BTC.
A lot of things have changed since the dot com bubble, but what hasn't changed is the frenzy and madness that parabolic bull runs cause. People still get greedy at the top and fearful at the bottom and markets always seem to trade the same in those environments.
Based off of the analog that I'm tracking it looks a lot like this recent run up in BTC is another failed bear market rally and we could be setting up to move below the 6k level on BTC.

I'm looking for a bullish divergence on MACD, that is a higher MACD with a lower swing low price followed by a lot of long slow consolidation.
Using the Nasdaq analog as a guide I see a new low in May, then sideways for about 3 months then moving in a nice slow uptrend, continuing the uptrend from pre-December parabolic spike, literally we can just erase that from the screen. That puts us back at BTC 20k by 2019/2020.
Check out this article I just posted on the Nasdaq/Bitcoin analog here https://steemit.com/bitcoin/@chris-d/j97kggmh
This is simply a scenario I'm mapping and so far it has been damn accurate.
As always this is merely to help me map the current and possible future state of the market which helps with position sizing more than anything. All my long/short trades are algorithmically based and signals are generated on statistical opportunity vs one persons interpretation of squiggly lines on a chart :)
This analysis is circulated for informational and educational purposes only. There is no consideration given to the specific investment needs, objectives or tolerances of any of the recipients. Additionally, actual investment positions may, and often will, vary from its conclusions discussed herein based on any number of factors, such as investment restrictions, portfolio rebalancing and transactions costs, among others. Recipients should consult their own advisors, including tax advisors, before making any investment decision. This report is not an offer to sell or the solicitation of an offer to buy the securities or other instruments mentioned. The research utilizes data and information from public, private and internal sources, including data from actual trades. While we consider information from external sources to be reliable, we do not assume responsibility for its accuracy. The views expressed herein are solely those of the author as of the date of this report and are subject to change without notice. The author may have a significant financial interest in one or more of the positions and/or securities or derivatives discussed.
A bit about me and my trading Journey
How I became a professional trader
https://steemit.com/introduceyourself/@chris-d/how-i-became-a-professional-trader
Trading during 9/11 attacks
https://steemit.com/crypto/@chris-d/short-selling-when-the-world-is-falling-apart
A Day in the life of a professional trader
https://steemit.com/cryptocurrency/@chris-d/the-day-in-the-life-of-a-professional-trader
Sweet Analysis @chris-d
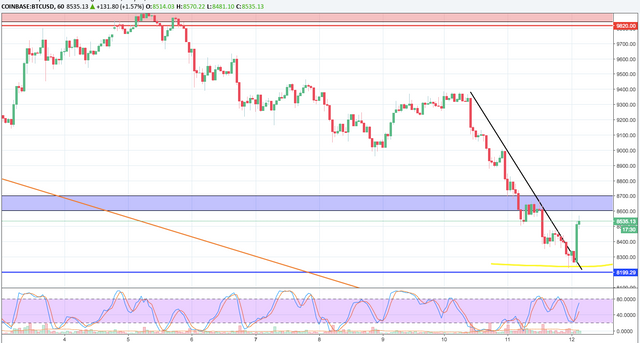
I believe BTC has found it's bottom here at $8,300, although it seems a little aggressive and there is till some room towards the downside ($7,500) 4hour looking good right now. Took a small buy at this dip. Keep up the good work :)
Downvoting a post can decrease pending rewards and make it less visible. Common reasons:
Submit
Nice place to catch it, I think we do have tradable support bounce, possibly leading higher...so far so good! Congrats
Downvoting a post can decrease pending rewards and make it less visible. Common reasons:
Submit