CryptoKraze here
Possibility on 1 Hour Chart

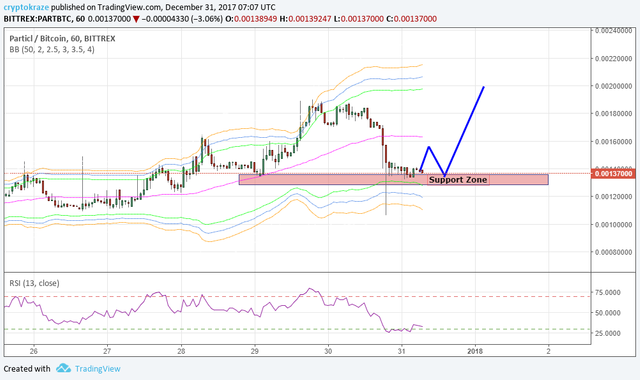
If you look at 1 hour chart, you will see Particle is entering in the support zone now. It is more like that it will find a support here and move up again. If we look at RSI, it has below above 30 level and oversold, so it has to move up because price cant just keep going in 1 direction. Let's have a look on Bollinger bands, price is almost touching the lower band and it is high possibility that price will bounce back from this support zone.
- I will have a buy entry at 0.001350 with my profit target will be around 0.001810 or above.
- Stop loss just below the entry area is must for trading if you don't know the Averaging Technique in Crypto Trading.
Crypto Trading is risky business and you can loss partial or full amount of money. Trade at your own risk with that money only you can afford to lose.


Good support level!
Btw, unless you are shorting, ;-) you want to remove two zeros from profit target:
"I will have a buy entry at 0.001350 with my profit target will be around 0.00001810 or above."
Downvoting a post can decrease pending rewards and make it less visible. Common reasons:
Submit
Thanks for highlighting, that was just a typing error.
Downvoting a post can decrease pending rewards and make it less visible. Common reasons:
Submit
Your trade is already working, price is bouncing above 0.0015... good call.
Yeah I figured it was a typo, that's why I put smiley after shorting :-)
Downvoting a post can decrease pending rewards and make it less visible. Common reasons:
Submit
Technical analysis works most of the time. even if trade does not go straight as I say, then you can see my averaging technique.
Downvoting a post can decrease pending rewards and make it less visible. Common reasons:
Submit
nice post
Downvoting a post can decrease pending rewards and make it less visible. Common reasons:
Submit
very informative post. keep sharing <3
Downvoting a post can decrease pending rewards and make it less visible. Common reasons:
Submit
thanks bro! real analysis
Downvoting a post can decrease pending rewards and make it less visible. Common reasons:
Submit