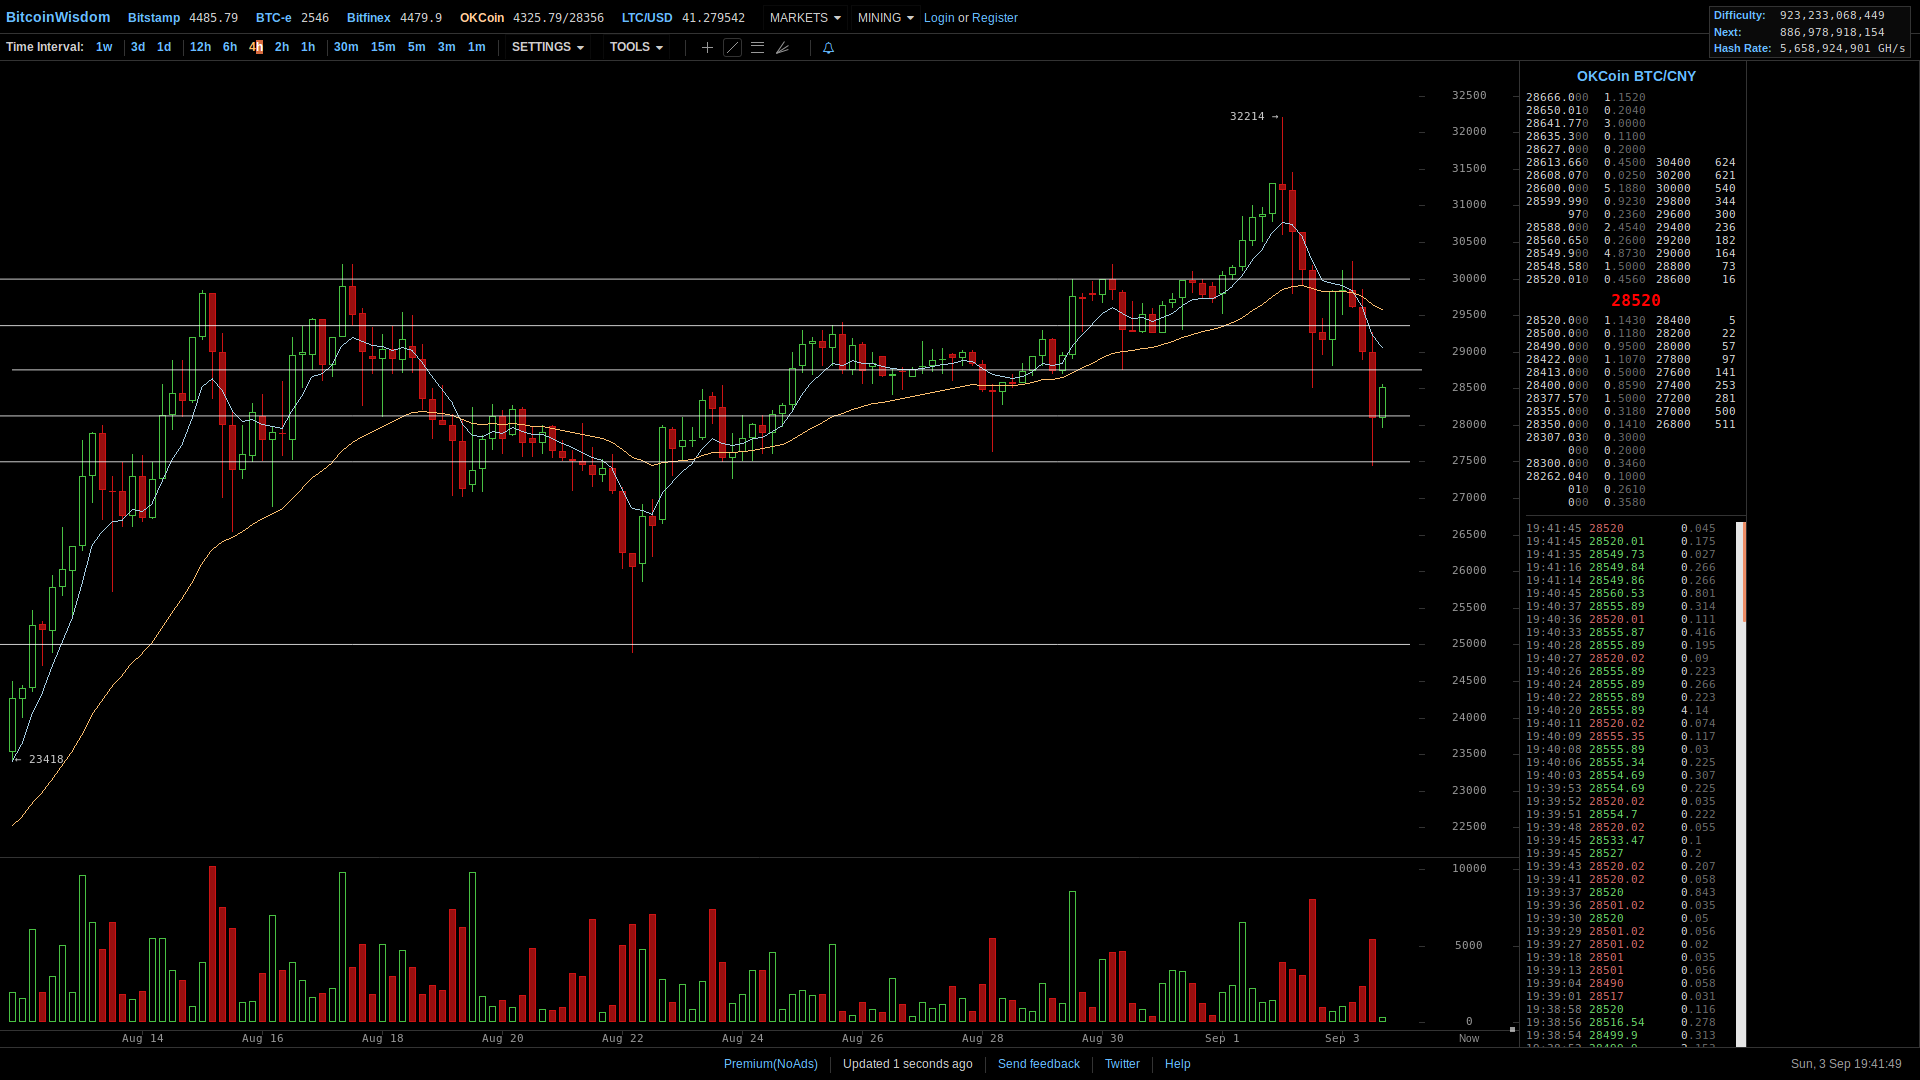
OKCoin Exchange Chart
Sep 09-03-2017
Price 28520
Horizontal Lines
30000
28750
28125
27500
25000
Main Resistance
30000
29375
28750
Main Support
28125
27500
Chart Pattern
H & S
Noticeable Volume
4h Timeframe

OKCoin Exchange Chart
Sep 09-03-2017
Price 28520
Horizontal Lines
30000
28750
28125
27500
25000
Main Resistance
30000
29375
28750
Main Support
28125
27500
Chart Pattern
H & S
Noticeable Volume
4h Timeframe
