Hi guys!
Here are my TAs on bitcoin price for today.
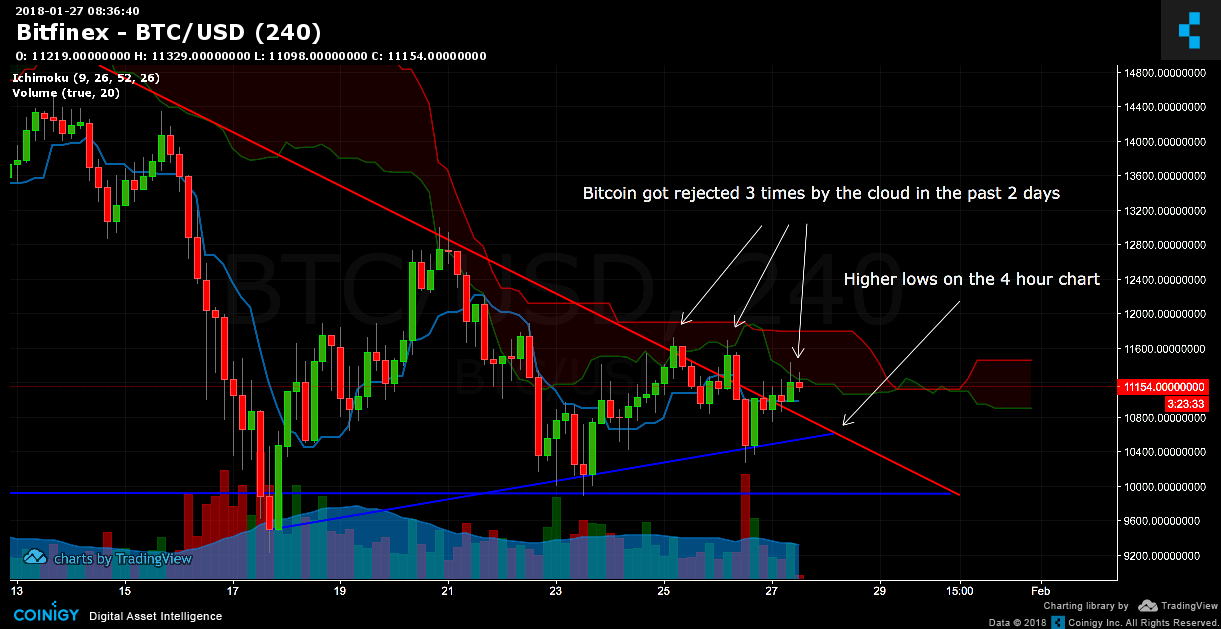
BTC - 4 Hour Chart
Tools used: Ichimoku Cloud and Trendlines

We've seen bitcoin got rejected for a few times by the cloud. So, far we are still under the cloud. And if we look at the shape of the cloud we might continue consolidating on this price for a while.
Also, notice I've drawn what looks like a upward trendline. On the shorter time frame it looks like bitcoin is making higher lows but I will show you that time frame could give you a false signal.
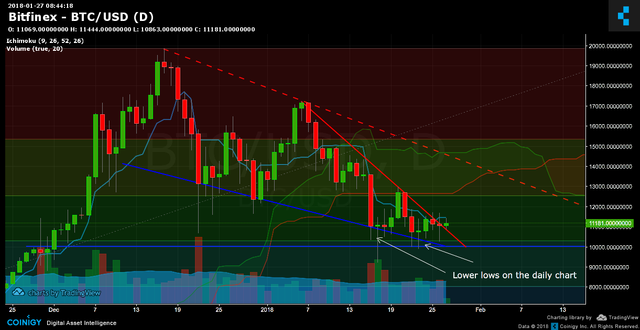
BTC - Daily Chart
Tools used: Fib Retracemens, Ichimoku Cloud and Trendlines

Checkout the higher lows on that was visible on the 4 hour chart. On the daily chart it is still a lower lows. Always see the bigger moves on any trades.
We still need a confirmation on this breakout. Meaning if the price have a pullback and bounce on the prior resistance on the breakout.
Conclusion
I think from the signs on the 4 hour chart is seems like bitcoin might consolidate around this $11,000 price area for the next few days (until 29/31 of January).
Disclaimer
You know the drill guys. This is just opinion and not a financial advise. Do you own research and decide your own trades. Cheers!
Great analysis once again! Bitcoins just waiting for the right moment to go on a massive run. Thanks for the post!
Downvoting a post can decrease pending rewards and make it less visible. Common reasons:
Submit
Thanks, it seems like bitcoin is slowly breaking out from the 4 hour cloud.
Downvoting a post can decrease pending rewards and make it less visible. Common reasons:
Submit