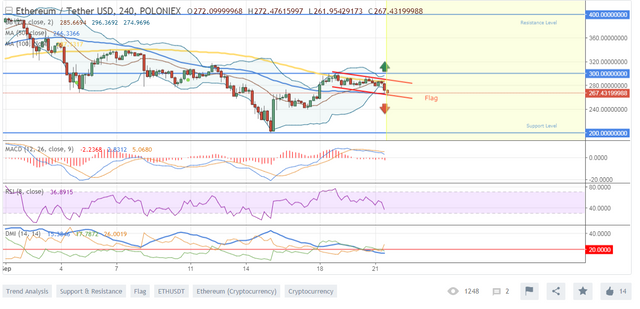
Flag chart pattern tells us about continuation of the upward movement. For this the price will have to break the resistance line of the flag and move above 300.00 resistance level . It will be a good opportunity to add some volume to long positions. If the market breaks the support line of the flag, we'll get a confirmation of further downward movement to 200.00 support level . This zone will be good for buying based on reversal signals. Now we have to wait for a breakout and follow the price movement.
If you like my analysis please help to upvote and follow
Enjoy trading
Thank you
Downvoting a post can decrease pending rewards and make it less visible. Common reasons:
Submit