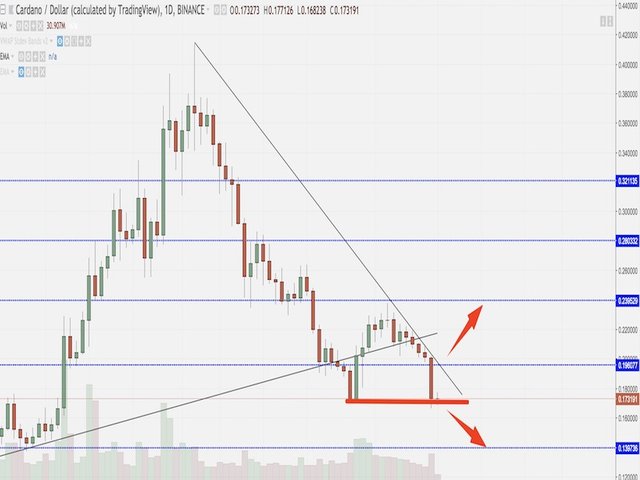
Cardano (ADA) comes from five downward sessions and on the day of 10 June the price opened in the area 0.20 dollars (on the relative highs of the day), then start the bearish run and close 0.1731 $. The resistances to keep under observation are: 0.1960 and 0.2395 dollars (monthly resistances), while for the supports: 0.10 and 0.1397 dollars (monthly supports).

For those wishing to buy Cardano
Wait for the breakdown of static resistance in area 0.24, with stop loss in the 0.1960 zone and take profit in the area 0.28 dollar cents.
For those who currently hold Cardano
The price has decisively broken the dynamic and static support opening up to new bearish scenarios.
For those wishing to sell Cardano
For those not already involved, enter the break of the previous minimum in area 0.1670, with stop loss at 0.20 and take profit in the area 0.13 dollars.
Target
Bearish
0.1960: reached May 23, 2018
0.14: not reached
Bullish
0.24: not reached
0.3211: not reached