08 March 2018 | Darcy K. Butcher, Journalist | Pacific Rim International
BITCOIN, BTC FORECAST
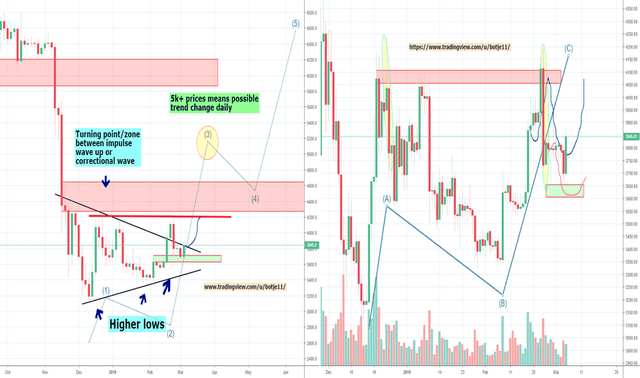
This is a major decision point for Bitcoin. Nothing is set in stone until confirmation occurs for either Bulls or Bears. On the higher time frames on Bitcoin is saying "Hold Your Horses!" There is plenty of upside to be had above $3940. Confirmation of volume and momentum would be key indicators. BTC is in a rising triangle channel.
STOCH
- Daily: Confirmation of a cross/posting above $3830 bullish
RSI
- Lower time frames signal bearish divergence
TD SEQUENTIAL
- Printed a 4 on the daily
LONGS AND SHORTS ON DATAMESH
- Shorts above 20k
- More interest in shorts as BTC is hitting major resistance
- Recent History: Five times shorts were in this range it led to major downside
NVT SIGNAL
Notable: This upper range has called all major tops for Bitcoin
- BTC is at 132
- Rising rapidly on Bitstamp
- Critical zone and a few more days of lingering here could occur
- Printing higher highs with lower price action (Bearish Divergence)
- Historically: Red Signal Zone above 140 signals major dump
- Major dump = up to 52% drop with 13-26 weeks to rise back up
- Bottoms typically range 50-90 on BTC
CME FUTURES
- Chart looks clear, clean
- Resistance line holding and has done so for over a month
- Move above $3930 here is bullish
GREYSCALE
- Bullish and backing off
- Need 4.82 to hold as support
- High side is 5.28 and considered bullish


TradingView: Botje11
TRADINGVIEW: BOTJE11 BTC TA
Starting to look like we might be headed for a double bottomish around 3700/3650. Depending on if we see at least a small bounce there or not.
A spike lower might happen, but only a spike! If we see a good bounce up, it could be the start of a continuation of the rally that started at 3400. If we don’t see a bounce, we have to start assuming bullish movement might be completely over for the coming weeks/months.
Yesterday i showed a potential smaller double bottom inside of the bigger one, almost identical to the one i showed a few weeks ago at the 3350/3400. The target of that small one was around 3770 which has been reached of course and at the moment we just broke the neckline of the bigger one around 3850. Just did a small break up while i am writing this, but no follow through yet though. Normally we should stay above the 3830 now so we can go towards the target of the W bottom around 3950/4000. If we break 3830/20, the attempt could fail, but so far volume looks good and bulls are holding their levels.
Bigger picture:
That "fractal" i showed a while back (yellow circles on the right) have been playing out so far. That blue line from my post of a few weeks ago might get completed now. A lot will depend on if the bulls can increase volume and break the 4000ish zone. If that happens, we could see another attempt at the 4200ish zone. If that happens, we have some kind of inverse H&S , with a big neckline around 4200. Also that higher low pattern, which remains unconfirmed below the 4200.
But confidence and volume is very important. I think we are at an important stage now, because if we can break the 4200, there will be chances for 5K+ prices. However, as you know from Part 1 of this analysis, we need to see a break of the 4600 zone. I think that is the key level between just a simply correction of the Bear trend, or that we see a much bigger correction, or possible even a trend change. I am personally not seeing a long term trend change, simply because volumes are too low in general. There is just not enough money in the crypto market.
My theory now is, a lot of people have a hedge running from the 4400/4600 zone (meaning they shorted there in Nov/Dec to protect their Dollar' value of Bitcoin ). So a break of this zone, will make all these people buy back their hedge position, fueling another push up. Probably in combo with the markets FOMO, we could see 5K+ prices.
Short term: The movement of the past week, can still all be just a correction of that big dump. Meaning, we can easily make a lower high in the 3850/4000 zone. That's why volume is so important at this stage. Because dropping volume simply means there are not enough buyers and they will loose the fight and bears will take over, that translates into a lower high.
So for now, we should stay above the 3830/20, if bulls can manage that, we should be able to reach the 4000ish. If this happens, we have to see how things go first, to be able to judge what the next step will be. Based on volume , maybe a bull flag or a triangle or whatever other pattern, we can judge things better. Open Intrest on bitmex, weakness/strength of alts also give decent indications. All these kind of tools should be used to be able to make a judgement call. Volume is the most important factor of all, because that is something that can't be hidden.
While i am finishing this, we just had a small dump to 3805, but the volume was low, so doesn't make real sense. Was just a wick, so could be noise. I showed my tick chart in my channel, where you can see it was Bitmex initiating it. When looking at ETH' (which usually shows the way), we don't see any weakness there yet. So for now, i assume it was just noise.

LIGHTCOIN LTC FORECAST
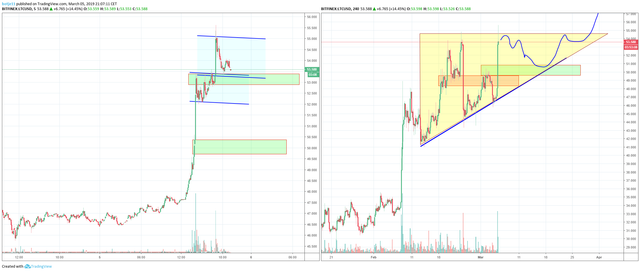
Lightcoin taking stabs at the top. Looking at triple top on the high side. LTC and BNB have led the bulls. LTC is in a brooding ascending wedge. LTC closed above the horizontal trend line yesterday. It is starting to lose momentum and looks like distribution. A break down and bounce up could occur. Pull back would test $52.50 -54.50 range.
STOCH
- Bearish Divergence on lower time frames
- The 10-hour and 12-hour are losing momentum
RSI
- Hitting Resistance
- Bearish with confirmation (momentum, volume)
NOTABLE: TD Sequential printed a 9 on the daily (BULLISH)


TRADINGVIEW: BOTJE11 LTC TA
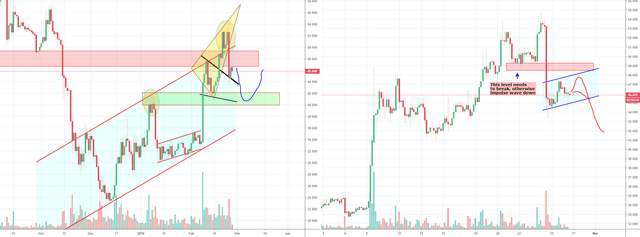
I have to say, LTC' has been stronger than i thought past week or so. After i wrote my previous analysis, it was still moving inside of a big bear flag . I suggested at least another drop would happen, which it did. But instead of a lower low, we saw a good bounce up from that low, forming a double bottom which has never been broken since.
Part of my previous analysis:
Anyway, seems we are moving inside of a big bear flag now after this big dump. It is very likely that we will see another drop happen coming days to test support. To see where buyers are willing to get in again. Ideally we stay above that thick black line, but i doubt that. Staying above 40/42 is a must though, because if that one breaks anything can happen. Maybe that big channel will give support again, but i would give it 30/40% chance it will hold then. So only a break of 49ish could make things bullish again, but i give that like 25% at this point.

That double bottom shows there were a lot of eager buyers waiting to get in at the 44 prices. This shows that one always has to stay objective, because some signs (price movement) can indicate a change of plans.
Part of my previous analysis:
Litecoin is holding it's ground quite well, making a double bottom just now. Much too soon to say if that will be it, but it is possible. I do think another test might be likely, but so far the bounce of ltc and btc has been stronger than i expected though.
A bounce like that can be noise sometimes, but one just has to be aware of it and not ignoring it because it doesn't suit your position.
Anyway, that big 49ish resistance broke today and still above it at the moment. Of course depending on what Bitcoin' will do next, it does look quite strong at the moment for the mid-term. We have a clear support line now (blue line), which can not break anymore. Because a break of that line, suggests the eager bulls stepping in each time, are no longer there. The triangle is just a realistic option for the coming weeks. Not saying it will happen, but in case we do drop some again, than we know what to expect. Normally we should stay above the green zone at 50ish. Staying above that previous high.
When looking at the left, the bigger picture, we can see this 54/55 is a big resistance, had some rejections the past weeks. We have been staying above that wedge , something i talked about the past weeks. With today's push, it shows bull are not scared and are at least trying to break the 55 zone. If it breaks, we could see anther rally towards that next resistance zone around 65.
When zooming in, we can see the first bull flag broke up already, now it should stay above that flag now. If it does break, we should not see a big dump, but a drop to 50ish is allowed for the coming day or 2. Bitcoin is trying to push up and break the high it made a few hours ago, if that happens, we will probably see LTC going to the next "stage" between 55/56. Think we need Bitcoin above 3900ish to see LTC really break that big resistance around 55

ETHEREUM ETH FORECAST
Ethereum is the weakest of these three coins. It is ranging in the middle zones on many indicators.
- ETH is holding support on the 21 EMA
- Resistance is $144. Break above to $152 range
- RSI, the 4-hour is bullish
- Stoch, 8-hour is down