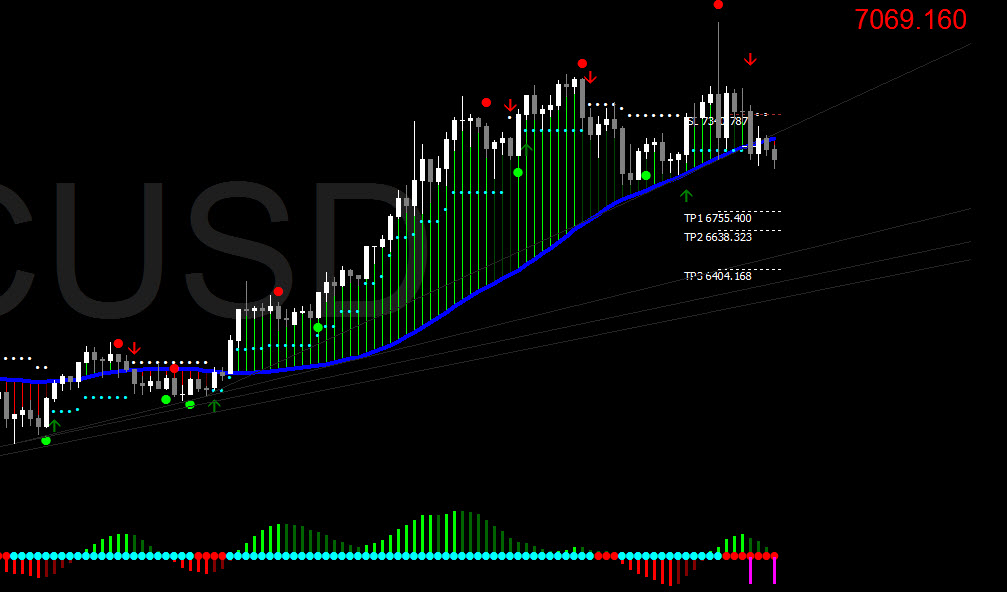
Here is a 4 hour chart looking to roll over into some lower prices. If this healthy pullback happens...load up the boat!

With that said there is some divergence against the higher time frames.
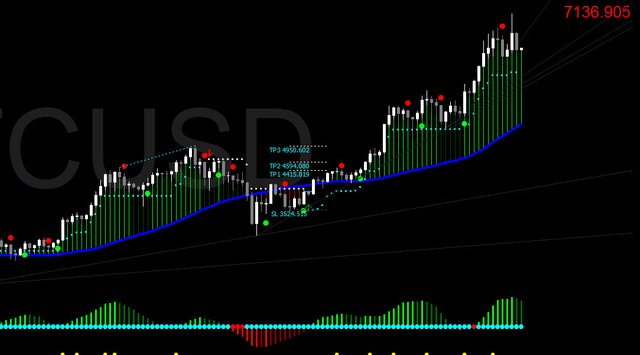
If you had bought in at $3939 as the flourishingpro system called on the daily chart ...sweet profits
Here's a look at the daily chart

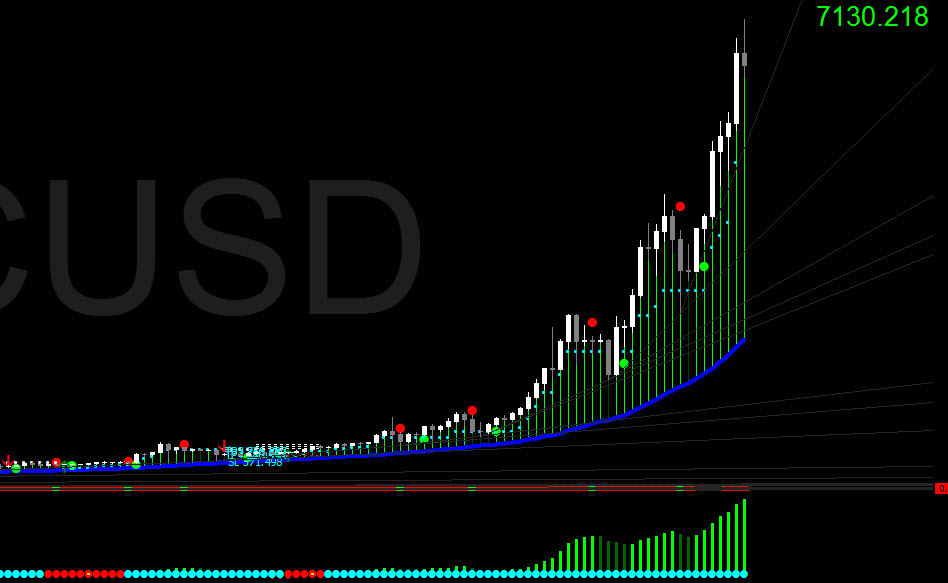
If you had taken the long term weekly signal at $617 and rode it all the way up....lets just say that work thing is looking an obsolete thing of the past.

I am cashing in on these signals...big time!
And don't worry a pullback is very healthy right now. it will not be a crash but more of an opportunity to get in at much lower prices
Remember trade what you see and not what you think.

Downvoting a post can decrease pending rewards and make it less visible. Common reasons:
Submit
Thanks
Downvoting a post can decrease pending rewards and make it less visible. Common reasons:
Submit
BTC will only rise and rise :p
Downvoting a post can decrease pending rewards and make it less visible. Common reasons:
Submit
Looking that way. Remember nothing goes up in a straight line but there is plenty of room for higher prices here.
Downvoting a post can decrease pending rewards and make it less visible. Common reasons:
Submit
ofcourse it wont go up straight line, i remember when BTC was 200 €, fun times.
Downvoting a post can decrease pending rewards and make it less visible. Common reasons:
Submit
You know it
Downvoting a post can decrease pending rewards and make it less visible. Common reasons:
Submit
anyway, you do trading ? or you just research that.
Downvoting a post can decrease pending rewards and make it less visible. Common reasons:
Submit
I trade my own account, more technical that fundamental analysis
Downvoting a post can decrease pending rewards and make it less visible. Common reasons:
Submit
im looking to get into trading forex, but i dont really know where to start, ive failed so much :P
Downvoting a post can decrease pending rewards and make it less visible. Common reasons:
Submit
It is a bit of mine field if you dont know what you are doing or uncertain how to proceed
Downvoting a post can decrease pending rewards and make it less visible. Common reasons:
Submit