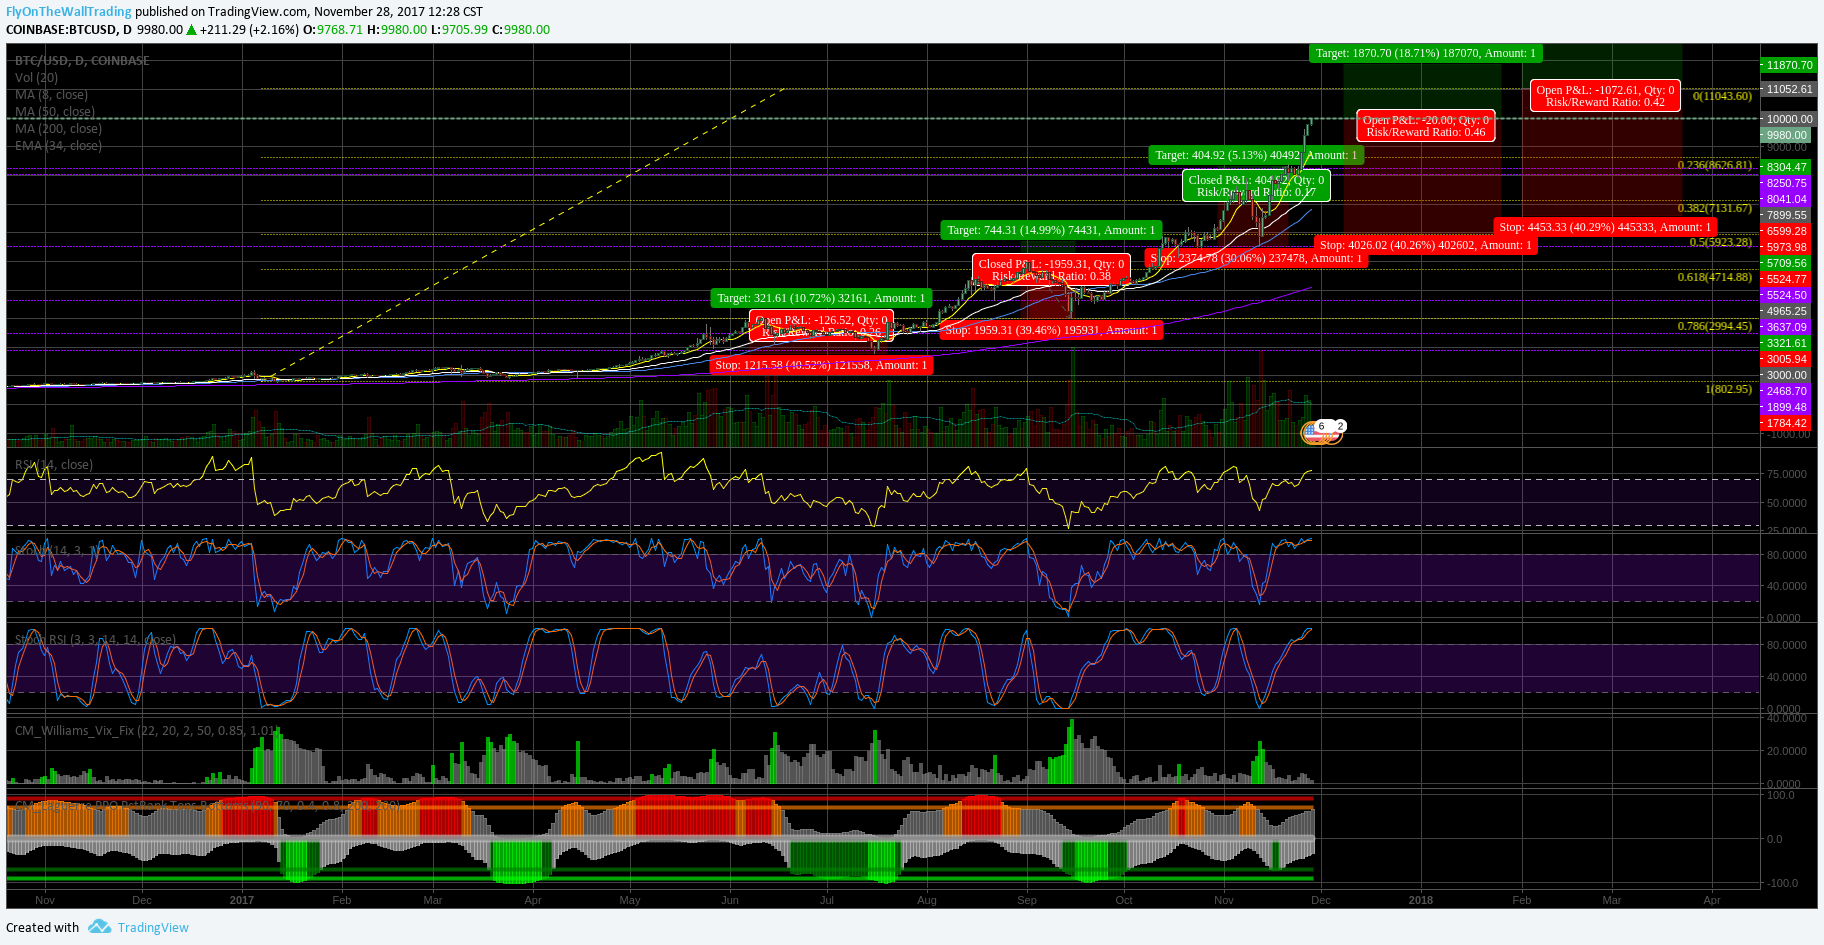
Hey everyone , I wanted to share something I drew up a short while ago, regarding bitcoin all time highs and where we are headed when bitcoin reaches the $10k/11k area.
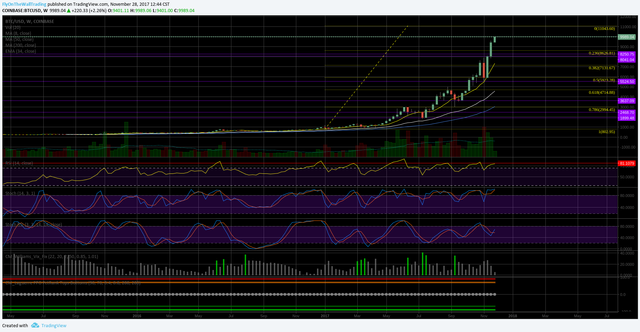
In the daily chart, I have marked the corrections we have seen this year in a manner that will show how much loss you woud take if you buy the top and sell the bottom (the numbers at the bottom of the red boxes). I have also marked where a pullback would bring us to if we correct at either $10k or $11k, using the maximum correction % we have seen this year. In the weekly chart, I have marked the lowest level of overbought conditions on the RSI where we are likely to see a market correction begin.
Bitcoin/USD consistently corrects 30/40% when a market correction is due. Overall, I am still bullish on the bitcoin and crypto markets, but would advise everyone to be prepared for a dip.
I would also recommend entertaining the possibility of seeing a true retrace (when originally playing with this chart in August, a fibonacci retracement was used as a forward-looking tool to determine future levels of resistance/support). If we see a significant retrace (entirely possible), I would not be surprised to see BTC return to the upper $4k area.
BTC/USD 1day candles: https://www.tradingview.com/x/9o4eX2aj/

BTC/USD weekly candles: https://www.tradingview.com/x/5JeV0aK4/

Congratulations @flyonthewall! You have completed some achievement on Steemit and have been rewarded with new badge(s) :
Click on any badge to view your own Board of Honor on SteemitBoard.
For more information about SteemitBoard, click here
If you no longer want to receive notifications, reply to this comment with the word
STOPDownvoting a post can decrease pending rewards and make it less visible. Common reasons:
Submit