Today's cryptocurrencies are on average in the red zone. Bitcoin is down 6.85%, Ethereum is down 8.32%, and Solana down 15.62%.
Today's Bitcoin price is still in the $61k range, a break of this support level could possibly bring Bitcoin down to the $50k level. Market sentiment shows bearish.
The crypto dump may still continue. Or maybe this is because OKX as one big exchange in the world officially announced discontinuing support for the Tether (USDT) trading pair in the European Economic Area (EEA) ahead of the implementation of the European Union's comprehensive regulatory framework for cryptocurrencies
Bitcoin/USD Technical analysis today
Bitcoin prices have fallen 13.70% during the week after the big Bitcoin dump occurred after Bitcoin recorded several new ATHs in March 2024.
Today's bitcoin price performance moved in the range of Low $61,982.17 and High $68,106.93 in 24 hours.
The fear and greed index shows a value of 83, which means the market has extreme greed even though there is a decrease in points.
The Fed meeting is also an important issue on Wednesday this week, where the FED rate decision may affect the market, including cryptocurrency.
Today's summary of indicators by Investing produces a strong sell signal from the details of several indicators including RSI, ADX, William %R, MACD Stochastic, and so on. Meanwhile, moving averages in the 5.10, 20, 50, 100, and 200 time periods also provide strong sell signals.

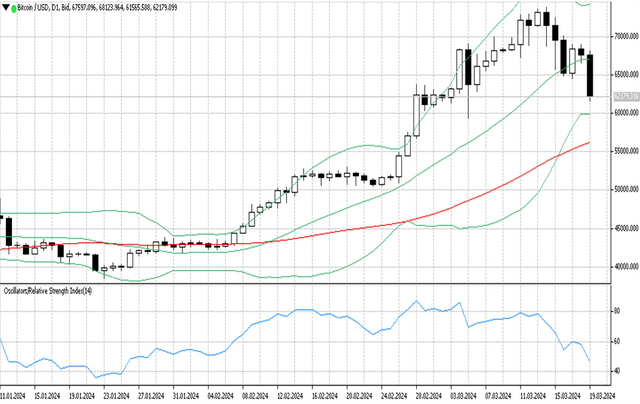
On Ticktrader FXOpen, the price is now forming a long body bearish candlestick with almost no shadow on top and bottom candle. This reflects a strong decline in the BTCUSD pair
On the daily timeframe, Bitcoin price managed to cross the middle band line from the upper side and brought the price near the lower band line. The $60k price area may be a support zone near the lower band.
MA 50 is still drawing an ascending channel below the lower band line reflecting bullish sentiment in the long term, this could be dynamic support in an uptrend market.
The RSI indicator now shows a value of 46, which means the price is moving below the downtrend level.

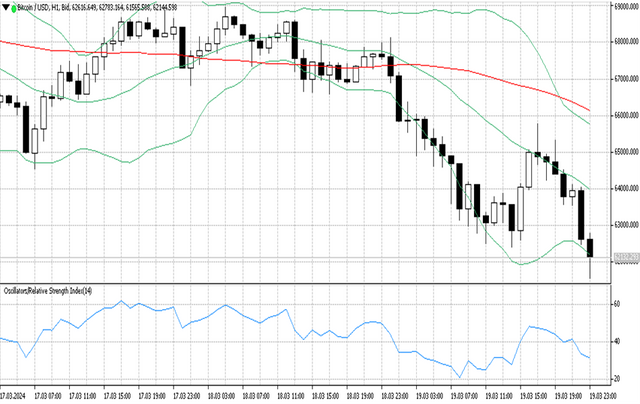
On the H1 timeframe for short-term trading plans, Bitcoin price moves below the lower band, a breakout of the lower band line in this timeframe is an indication of a strong decline occurring.
The Bollinger band line in this time frame appears to be drawing a descending channel with a wide upper and lower band distance, an indication of high market volatility.
The MA 50 forms a slight descending channel above the upper band line indicating bearish sentiment, while the RSI indicator shows level 31, which means the price is below the downtrend level, almost entering the oversold zone in this time frame.
Support and resistance
S3: 25954.7
S2: 38471.6
S1: 50587.6
R1: 73727
R2: 73727
R3: 73727
#solana #bitcoin #ethereum #cryptodump #ticktrader #fxopenuk