One of my mottos with respect to cryptos or other securities is - 'When in doubt, zoom out!'.
We can get distracted in what's been happening recently and lose the guidance of the longer term perspective. Let's zoom out to all of BTC price history to see if a pattern can be discerned.

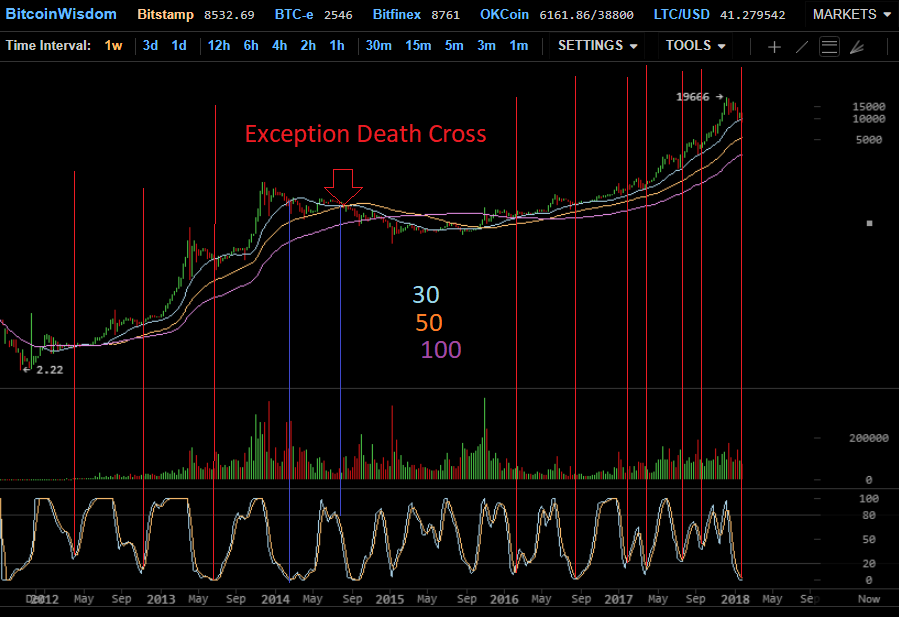
Looking at a weekly chart of all BTC data we notice 9 of the previous 10 declines were stopped by the 20 period moving average. ALL of those bottoms were additionally correlated with extremely oversold Stochastic RSI.
There was 1 exception that wasn't stopped at the 20 period moving average and broke further on the death cross of the 20 and 50 period SMA. On the subsequent breakdown the Stochastic RSI remained extremely overbought instead of oversold.
Currently BTC is atop its 20 period moving average with extremely oversold Stochastic RSI just as it was at the reversal point of 9 of the 10 past major declines.
I'm not saying BTC is guaranteed to bottom here. I'm only saying that based upon our small sample the odds are 90% the decline is about done and 10% it has only just begun.
The point of this post is not to predict, it is to observe from an objective, actuarial perspective and act accordingly. The point is to identify where the market itself indicates to us what it is doing and the point of minimum risk and maximum reward by which we may profit on either subsequent outcome. The point is not to predict, it's to make money.
Edit: the '30' on the chart should read '20'.
Downvoting a post can decrease pending rewards and make it less visible. Common reasons:
Submit