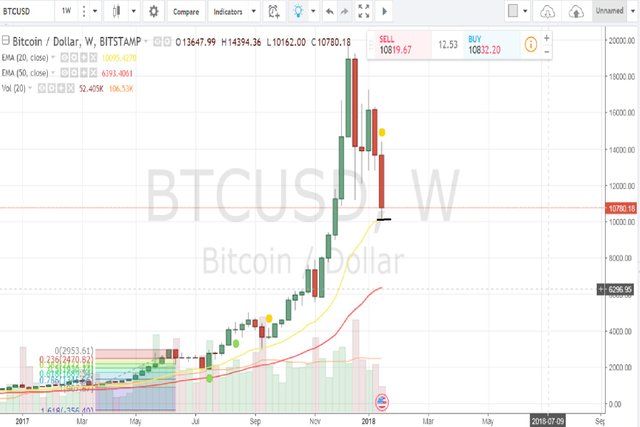
Bitcoin fall through its horizontal support at $12560 on daily chart. It has found support so far at $10100 on weekly chart at its 20 EMA. We will have to see if it takes this support or just breaks through it. Bears are in control so far and we will have to wait and watch. If you are looking for a entry point, wait for a confirmation candle (doji) on weekly chart.
Daily Chart

Weekly Chart

Good Luck !!
Disclaimer :
This post is my personal opinion and is provided for informational purposes only. Don't consider buying or selling any crypto currency without conducting your own due diligence.