Join our Telegram group - https://t.me/joinchat/GXO2tBJ1TWgm0AHo9d4Scw
*We're always around to be of help in all things crypto and blockchain :)
At the time of writing, IOTA price is currently sitting at $0.46
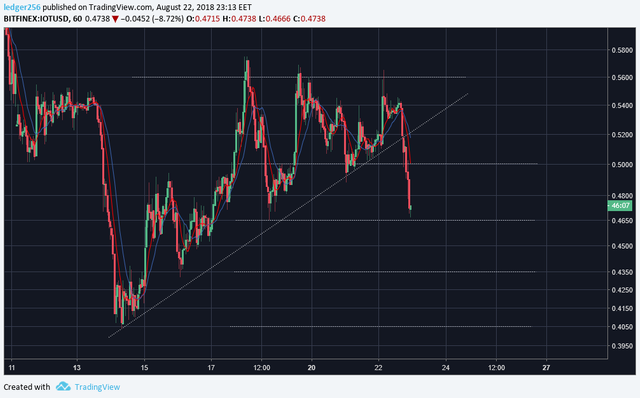
It looks like IOTA had more range in its swings over the past several days. We've drawn an uptrend on the chart, but it's really only for demonstrating the general direction of IOTA rather than an actual solid trend line. Anyways, IOTA recently broke down from that, and seemed to have tested $0.465 as support once again after the dip on August 18th. It's kind of a delayed move, but it looks somewhat similar to the breakdown from the wonky ascending triangle observed with a few coins a few days back.
Anyways, right now we're right on the edge of the support level, $0.465. If it can't hold this level, next one we'd look at would be around $0.435, and below that, $0.405. On the upside, and if IOTA can hold this current support, next level we'd look at on any move up would be $0.5, but only for a confirmation of a move up, as it's less solid than some of the other levels. Above that, ideally we would see IOTA consolidate a bit before any other test of the upper resistance line at $0.56, which is the main resistance for us at the moment.

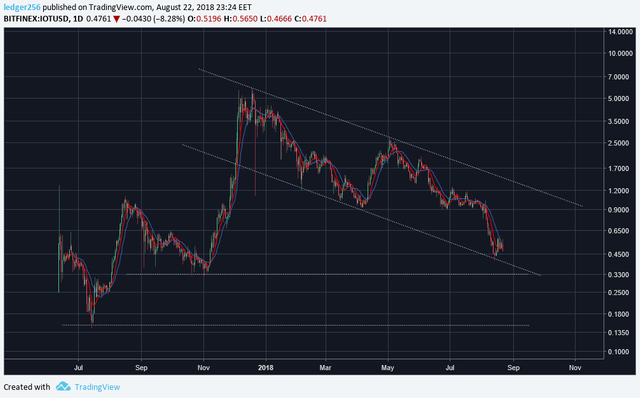
If we zoom out and look at the bigger picture, we'll see that while IOTA has retraced quite a bit since its ATH, it still has some room on the downside. We can also see that it has been trading within the same channel since December.
If you're fundamental long/bullish on IOTA, you have a couple of options. The first would be to long here for a medium-term play to the top of the channel and then exit. The second and most conservative option would be to wait and see how IOTA looks at $0.33 (the November 2017 lows) instead and long from there. If you want to be more conservative, you could wait for a full retracement to the July 2017 levels at $0.15, although many IOTA maximalists would argue that's impossible to achieve.
Right now, there doesn't seem to be an optimal entry to short IOTA; we have it right along the lower side of a descending channel AND right above a long-term support line, so it would be pretty risky.

On the daily chart for IOTA, technical indicators give a bearish outlook (14 sell, 10 neutral, 2 buy)
On the weekly chart for IOTA, technical indicators give a slightly better but still similar bearish outlook (12 sell, 8 neutral, 2 buy)
As always, if you have any questions, don't hesitate to reach out via email or through our Telegram group! (links below)
\
How to get in touch with us:
Follow us on Steemit - @ledger256
Join our Telegram group - https://t.me/joinchat/GXO2tBJ1TWgm0AHo9d4Scw
*We're always around to be of help in all things crypto and blockchain :)
Email us - [email protected]
DISCLAIMER
NO FINANCIAL ADVICE – The information on this blog is provided for education and informational purposes only, without any express or implied warranty of any kind, including warranties of accuracy, completeness, or fitness for any particular purpose. The information contained in or provided from or through this blog is not intended to be and does not constitute financial advice, investment advice, trading advice or any other advice. The information on this website and provided from or through this website is general in nature and is not specific to you the Reader or anyone else. You should not make any decision, financial, investment, trading or otherwise, based on any of the information presented on this blog or any affiliated channel without undertaking independent due diligence and consultation with a professional broker or financial advisory. You understand that you are using any and all Information available on or through this website at your own risk.
RISK STATEMENT – The trading of Bitcoins and alternative crypto-currencies has potential rewards, and it also has potential risks involved. Trading may not be suitable for all people. Anyone wishing to invest should seek his or her own independent financial or professional advice.