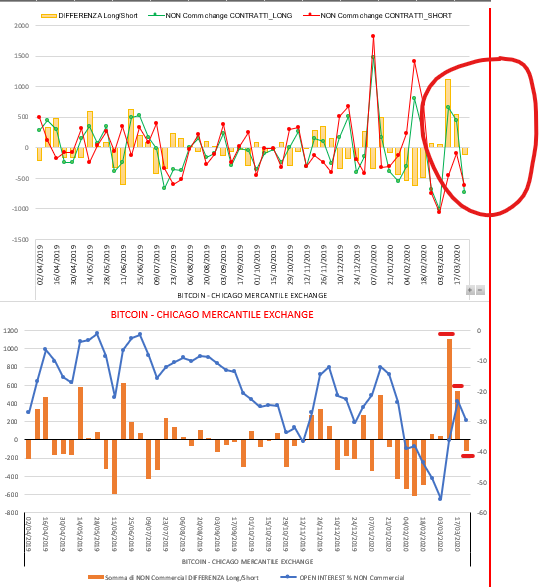
After the release of the latest COT data, it can be seen from the graphs how long contracts are decreasing therefore
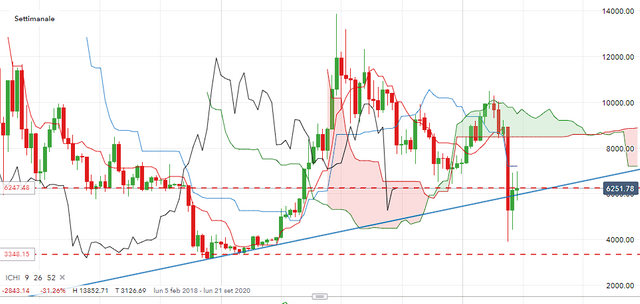
Bitcoin weakness can be expected. As we see from the price chart, Bitcoin is located between a bullish trendline but also an important static support. Since the institutional long contracts are decreasing, the trendline may be broken. At this point it could reach new support at around 3348


●▬▬▬▬▬▬▬▬▬▬▬▬▬▬▬▬▬▬▬▬▬▬▬▬▬▬▬●
• Personal Links:
► FB: https://www.facebook.com/diego.colombo.54584
► Steemit: https://steemit.com/@nordcaster
► Twitter: https://twitter.com/colombodiego74