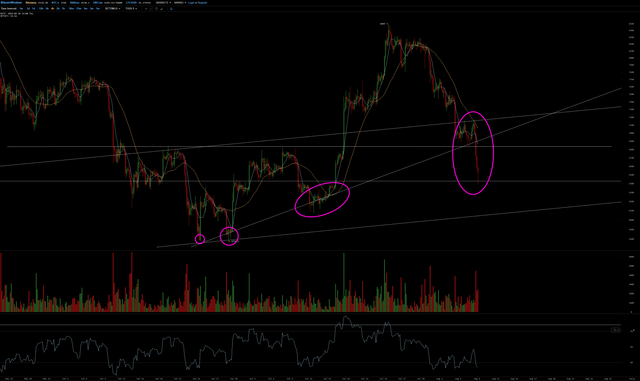
In June and July, there were already some signs that Bitcoin had tested or even traded Below its historical ascending support line.

Trying to adjust the lines to fit the facts in August simply didn't work anymore and the Big Bears decided it was time to break the 0.4%/day growth curve and move to a less steep modus.

Before I thought this was going to happen after reaching the next ATH but it clearly is happening Now.
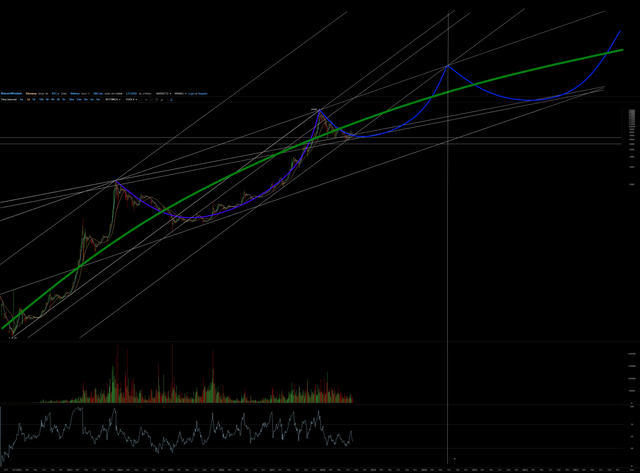
So I had to adapt my forecasts in accordance with the new facts and made a new projection for Bitcoin, based on a curve that is gradually flattening.
In all bad things there may also be something good however.
When Bitcoin's growth curve is flattening, so should this also be the case for its volatility. If we were to proceed within the very steep growth channel like in the past 8 years, there would arrive some moment that the great majority of BTC holders would decide to choose for safety and trade most of their coins for cash at some next ATH. Then Bitcoin would drop from 100K to 1K or less.
With a flattening curve and diminishing volatility, the risk of such a scenario becomes smaller and people will tend to stay (longer) in BTC before cashing out.
My new projection is now based more on the Momentum that can be perceived on the charts, in stead of clinging to wishfull thinking. This momentum tells me we are almost at bottom level and next ATH may be 2 years from now in July 2020 around the 120K mark, where it would hit the former historical support line as the new resistance.
Yeah, It will go 120 :)
Downvoting a post can decrease pending rewards and make it less visible. Common reasons:
Submit