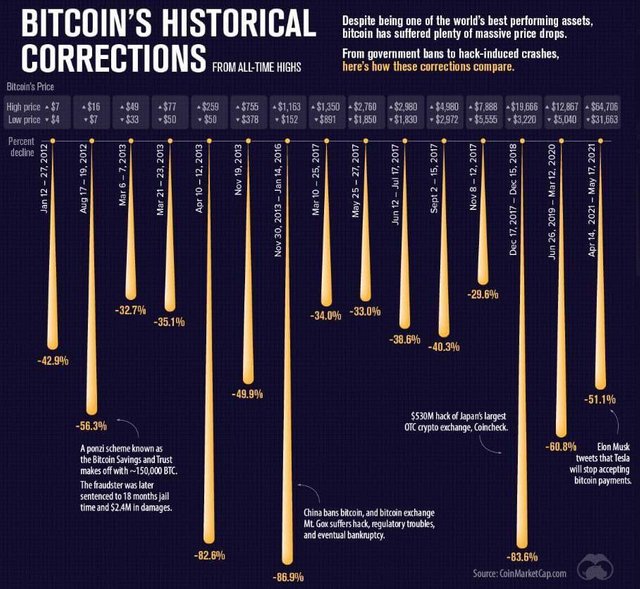
Bitcoin corrections from different peaks.
Yes in 2017-18 bull run we don’t have a correction of above 40.03 % (the dump that started bear season was -70% in 51 days). The given diagram mentions from a peak to the bottom between the time unless the same level was attained again (even if it took years for that).
Also in 2017-18 bull run the leverage trading was far lesser ... the coordinated liquidation events by whales weren’t supposed to be there.