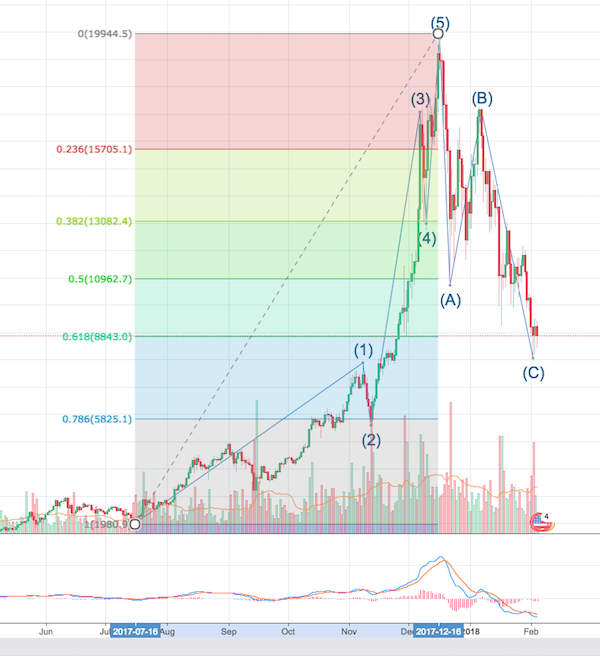
I like your analysis. While I applied similar techniques, I started the beginning of my first impulse wave up/ fib levels on July 7th 2017. I started there because it seemed that a previous cycle of the wave pattern had completed. When I examine your first chart image, it seems you started later in the year because all of your levels are higher than where mine are.

While not all critical points line up perfectly, I think my fib levels correspond well with (2) and (4), and kinda well with (C). What date did you start you fib levels? How well did the points in your Elliott Wave match? I also agree today is another critical day in determining whether or not we have completed the correction cycle. I think we have seen the lowest lows, but am very are that reality could prove otherwise. I am hopeful because it seems the price is currently holding at/ above the Golden Ratio and the lows are getting higher. I would love to see today turn into a green candle later by later in the afternoon for more immediate confirmation, however clarity rarely comes on schedule. But like I said, I completely respect and appreciate your perspective.