OSS CRYPTO FUND
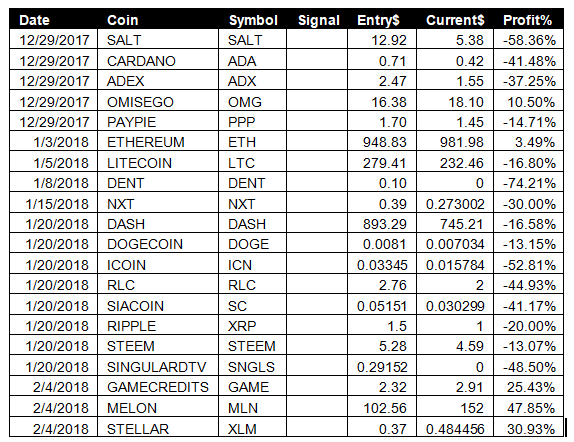
On Jan 20th, the Number 9 Indicator sounded a Buy signal on a number of cryptos, then on Feb 4th we got some more. It was clear the bottom was in or the bottom was close to being hit. We now have a few coins breaking into positive territory. I expect all coins will be in the green by the end of February, and many will handsome profits.
BITCOIN: CYCLICAL ANALYSIS 2018
The 2018 Cyclical Forecast for Bitcoin is now available. The forecast covers Oct 2017 to Mar 2019.
This forecast, like the forecast for 2016 and 2017, contains the cycle sets with the best fit to Bitcoin’s movements.
The forecast for the last two years can be found here:
Bitcoin-Cycles-2016.pdf
Bitcoin-Cycles-2017.pdf
• "Your Bitcoin cycle chart seems to be playing out very well" -- N.V.
• "Very helpful. Thanks, Rob!" -- D.F.
• "Very interesting work" -- Mat
• "This is a great service you provide" -- Brad

The 2018 forecast contains a number of new analysis:
• Long- & Short-Term cycles combined.
• Rate of Change for Short-term cycles
• Rate of Change for Long-term cycles
• Rate of Change for Bradley Siderograph
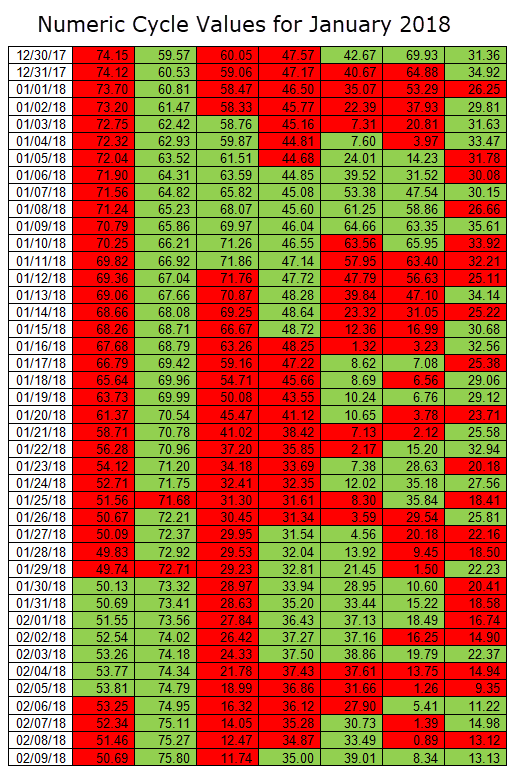
• Table of all daily numeric cycle values
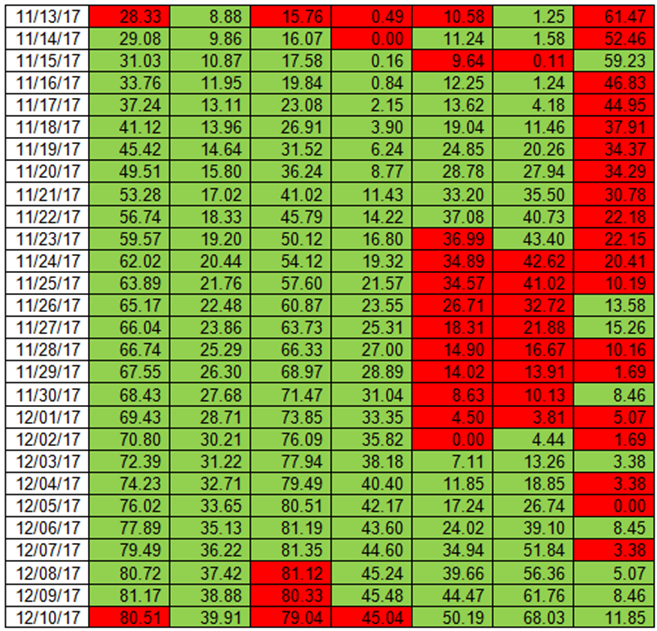
Two examples of the Table of Numeric Cycle Values can be found below.
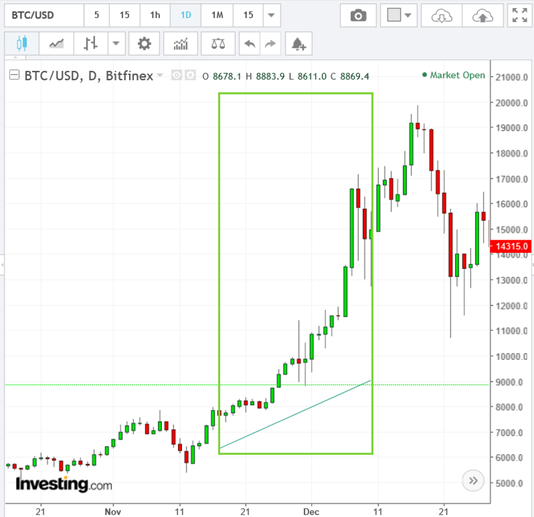
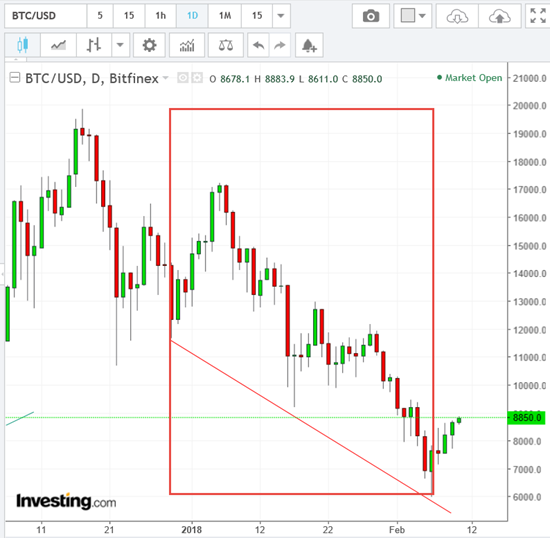
Forecast for November and the beginning of December was very Green (Bullish). See chart below the table for Bitcoin price movement.
Numeric Cycle Values for November 2017
Numeric Cycle Values for November 2018
Get you copy now at Bitcoin Forecast 2018
