A lot has been discussed today in my blog post. I covered Bitcoin price action since my last blog BTC update post, the On chain data, and U.S. inflation.
All this is my personal study and analysis, you can take trades accordingly with tight stop losses as the market is hyper volatile. Please do support with resteems, upvotes and follow me. Please do reply in comments section to let me know about how you feel and even suggest your opinions, ideas and even query.
• BITCOIN •
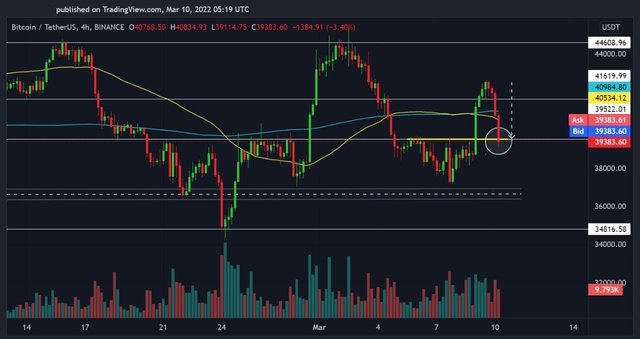
As I already warned you $42,500 to $42,800 is the area where we will see selling pressure and the same thing happened. Bitcoin also breaks the major Support area of $40,000 to $39,400.
Bitcoin needs to reclaim this area and give candle closing above it for further upside movement. If it is not able to Hodl then the next support level BTC needs to hold is $38,200
Also, Inflation data release caused volatility in the market.
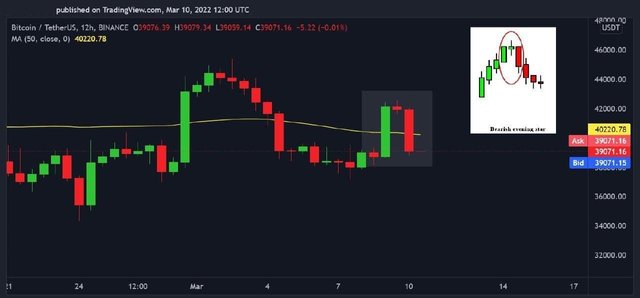
Bitcoin chart depicted evening star bearish pattern in 12H time frame. Bitcoin needed to give candle closing above 41,200 to nullify this pattern otherwise we would have seen see more crash in the Bitcoin price.
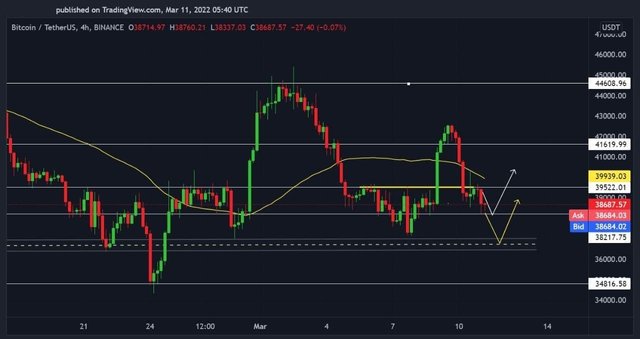
Bitcoin held above its support level of $38,200. If this level broke, we could see the price moving towards its next support area which is $37,200 to $36,400 From where we could have expected a bounce back.
BTC need to clear the $39,400 resistance level with good volume to gain Bullish momentum. If it fails to clear this resistance zone it could continue to move down.
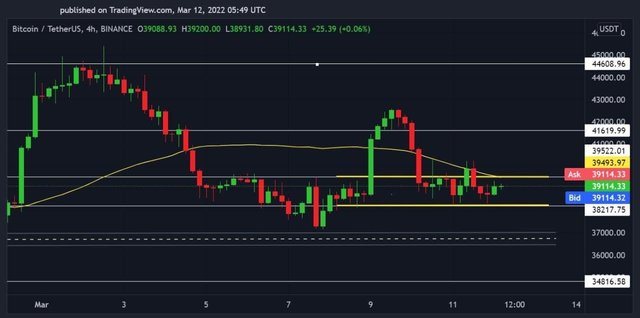
Bitcoin bounce exactly from the support level of 38,200 and tried to break the $40,200 resistance but got rejected.
Bitcoin trading above $39000 but it needs to clear the resistance area of $39,400 to $40,200 for the further upside movement.
Rest everything is the same as we per the previous chart, if bitcoin breaks the $38,200 support area bitcoin price could continue to move down.
More liquidation happening in the market. We need to be the very careful as the market seems to be very volatile.
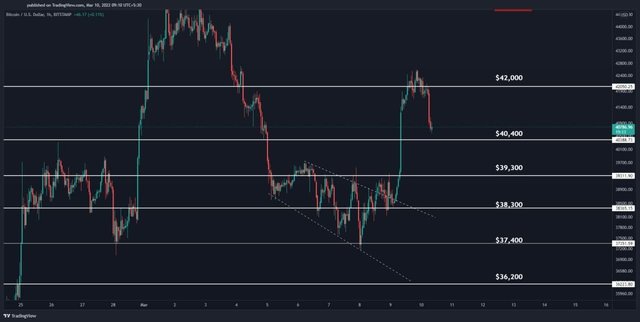
Support and resistance chart
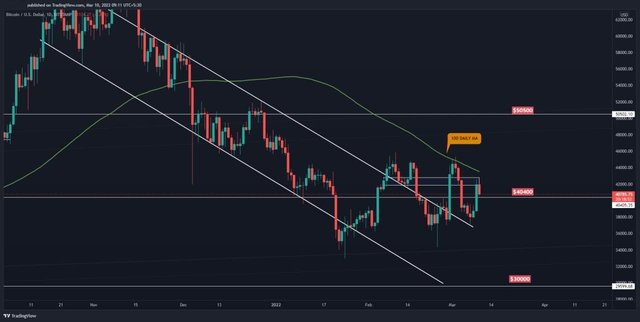
Daily chart
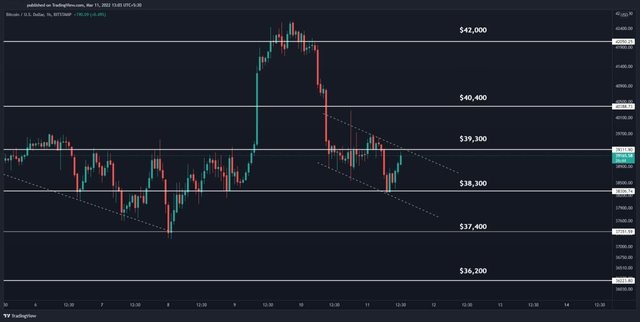
$ 39300 is the first important resistance zone, observe if BTC breaks the resistance and confirms support or gets rejected downwards.
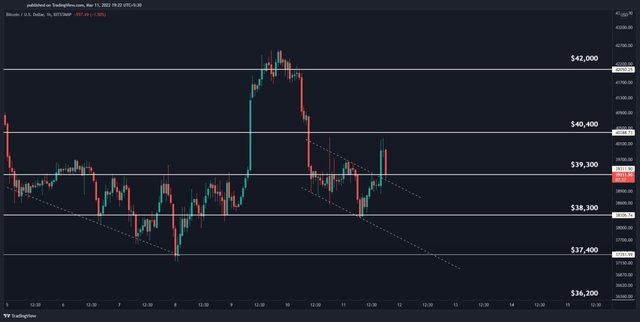
$ 40400 support has weakened now.
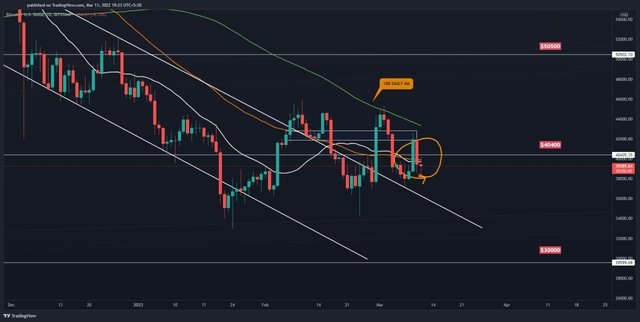
This is also where we have 2 imp Moving Averages, thats why its important to get candle close above it.
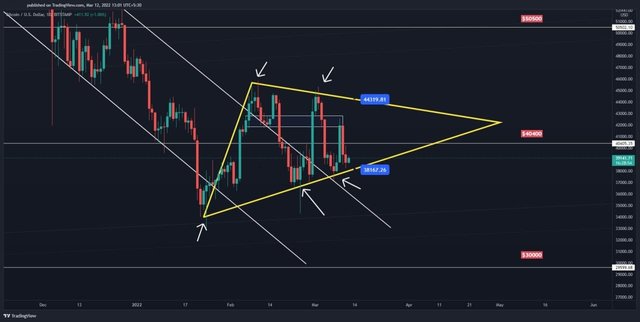
Trend lines based on bigger time frame.
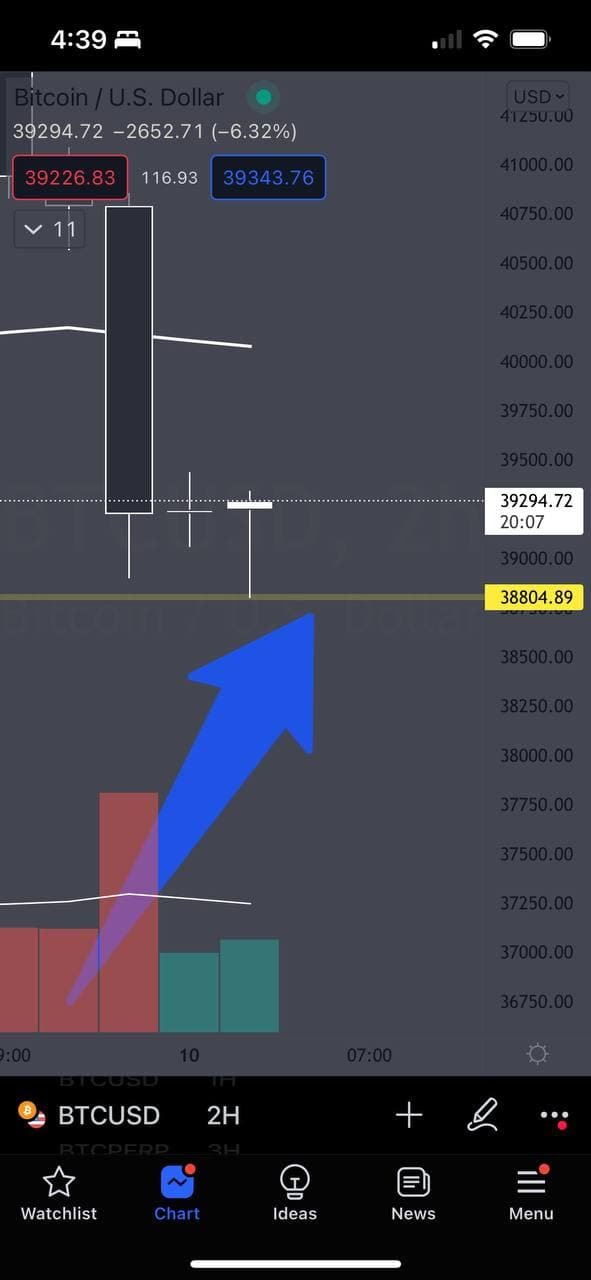
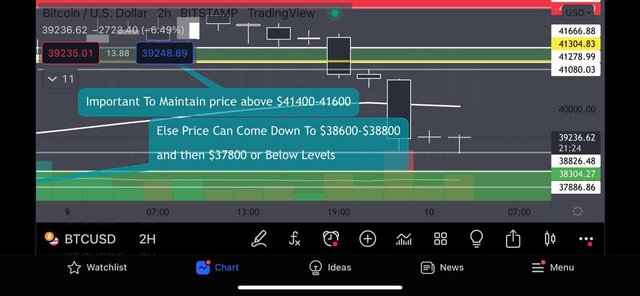
BTC following the support zones shared in my last blog post.
• INFLATION •
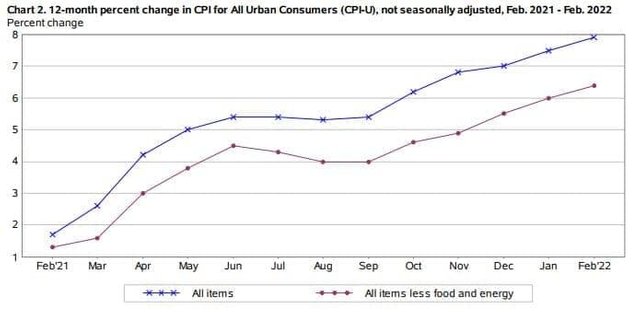
Inflation is up 7.9% year over year, as per Labor Department. The biggest jump since July 1981.
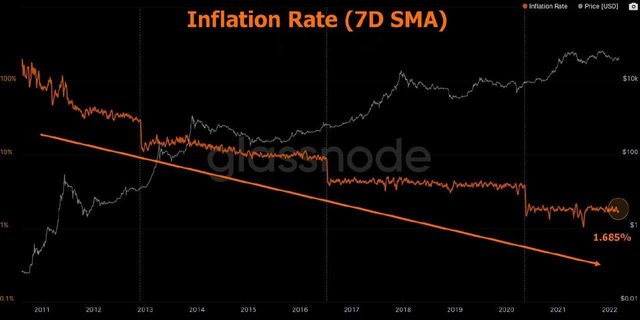
Bitcoin's inflation rate is currently at around 1.69% and systemically programmed to decrease over time.
• On Chain Data •
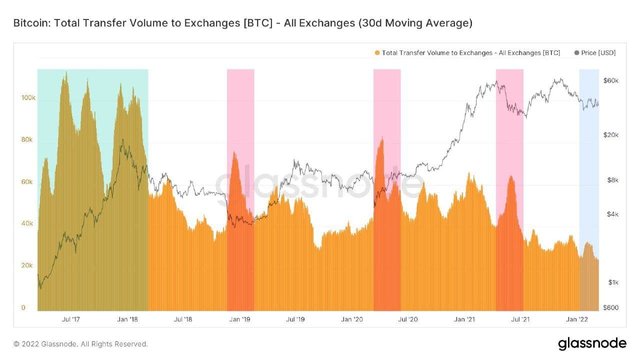
Total Transfer Volume to Exchanges (Denominated in #BTC) - 30 Day SMA
🟩 Cycle Ending Profit Taking
🟥 True Capitulation Events
🟦 Low Sell Pressure
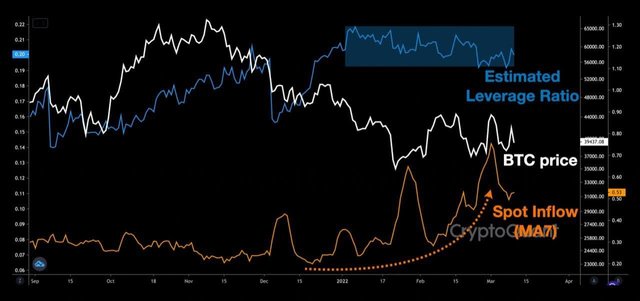
Despite the decline in BTC price over the past few months, the trend of inflow deposits to the exchange (MA7) has still been on the rise.
In addition, the estimated leverage ratio continues to be high.
If unfavorable factors such as macroeconomic issues and geopolitical crises occur, there may be an action of spot and short selling at any time.
So please pay attention to volatility for the time being.
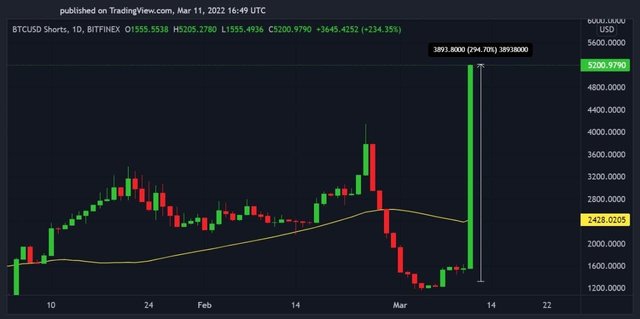
BTC Over the past 4 days, large investors on Bitfinex have accumulated a huge short. Short positions increased by 294%.
Be careful guys, market could take a sudden dip anytime. Use tight Stop Loss.
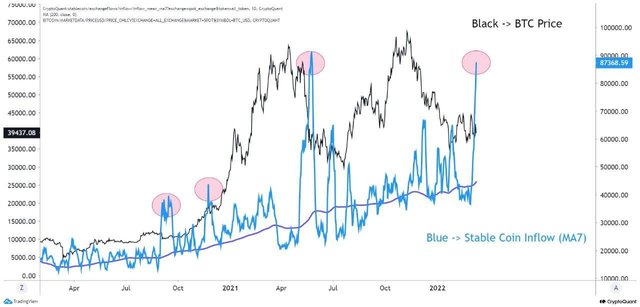
Smart money which is "stable coin inflow (MA7)" to spot exchange is showing that they are ready to buy BTC soon.
I hope the above analysis and market insight will help you all to make favourable trades and save yourself from losses. I would humbly request you all to please support me, this step from you all would keep me motivated.