Quick update steamians...
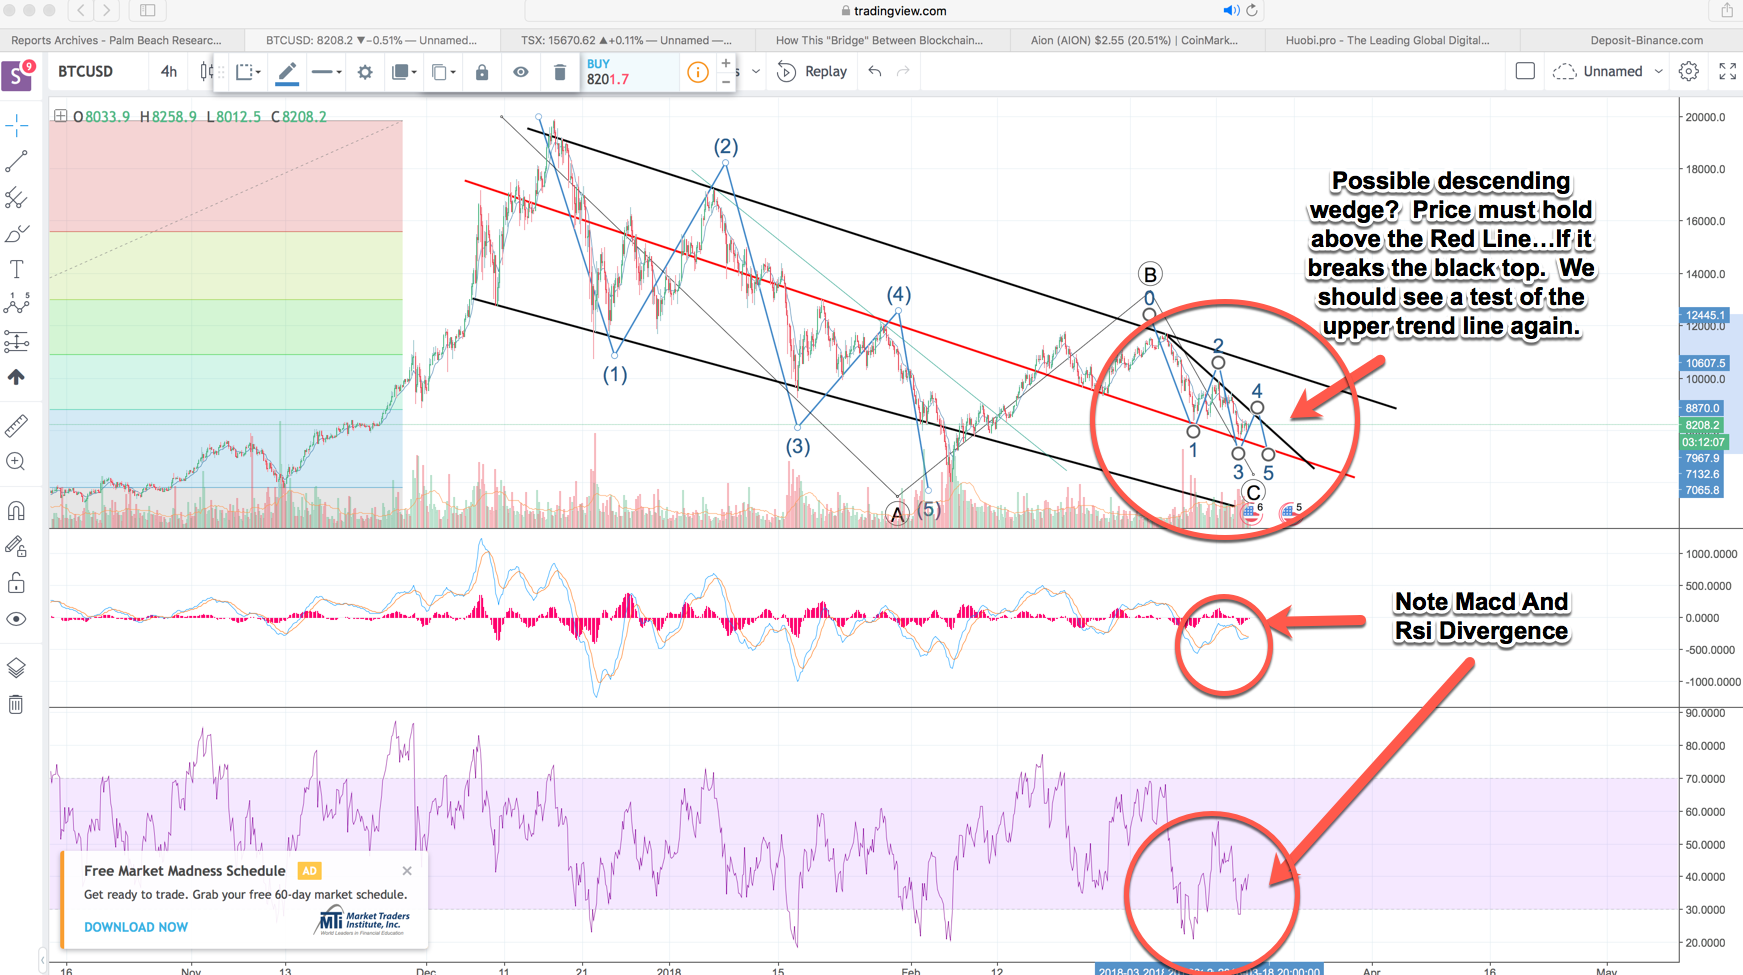
Below is a recent price chart and there looks to be a descending wedge happening. We would need to see price hold above the red line and break thru the above black trend line to see it have any hope to challenge the top black channel trend line.

The waves counts are mapped out to what it could be right now. If this counts holds to be true and stays in that wedge and breaks above the upper trend line, then we might see some big money finally come into this market and cause the nice third of a third wave I've been waiting for.
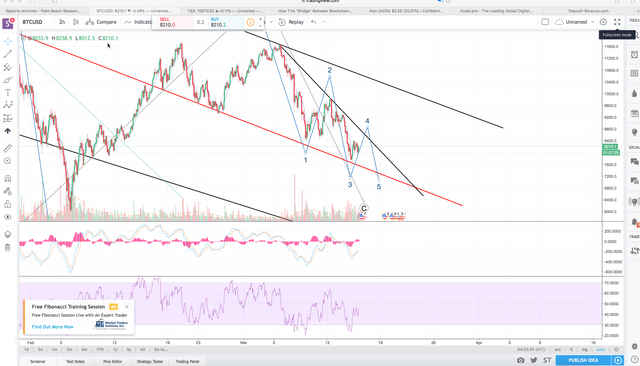
Here is a close up of the chart above.

Anyhoo I'm off to bed just thought I'd share my new possible count.
Thanks for reading.
Keep this up, Followed you for more :)
Downvoting a post can decrease pending rewards and make it less visible. Common reasons:
Submit