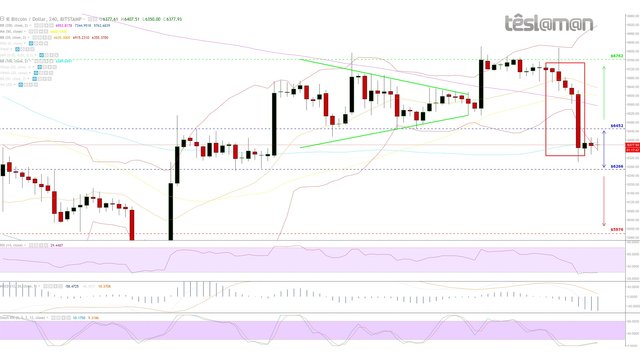
4H Chart - Price Key Points:
- Bulls failed to take advantage of the market.
- Rejection at approx $6725 with a minor waterfall continuation.
- 20MA and 50MA still above 200MA.
- Indicators attempting to find a temp bottom.
- Stockastic RSI paints a positive divergence.
- Negative volume increased a bit.

Possible Scenarios:
Long: On a confirmed break above $6452 – Price Target $6762 | Probability: 39% | Signal Strength: 4/5
Neutral: Price Range $6266 - $6452
Short: On a confirmed break below $6266 – Price Target $5976 | Probability: 37% | Signal Strength: 3/5
Our Stance: Neutral.
@teslaman nice chart bro keep sharing.
please follow me and upvote me to grow here
https://steemit.com/investment/@fxengineers/technical-analysis-of-gold-xau-usd
Downvoting a post can decrease pending rewards and make it less visible. Common reasons:
Submit