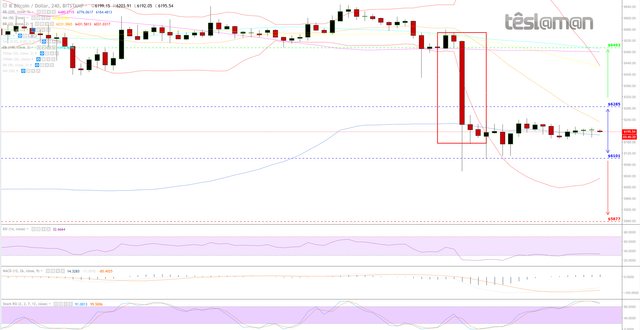
4H Chart - Price Key Points:
- In neutral range for the past 56Hrs.
- 20MA bollinger bands closing the gap.
- 200MA resistance at approx $6480.
- RSI with a slight positive divergence.
- MACD still negative.
- Stochastic a bit extended.
- Models suggest that a minor buying attempt might be possible.

Possible Scenarios (unchanged):
Long: On a confirmed break above $6285 – Price Target $6493 | Probability: 34% | Signal Strength: 3/5
Neutral: Price Range $6101 - $6285
Short: On a confirmed break below $6101 – Price Target $5877 | Probability: 38% | Signal Strength: 5/5
Our Stance: Tight speculative longs.
very good
Downvoting a post can decrease pending rewards and make it less visible. Common reasons:
Submit