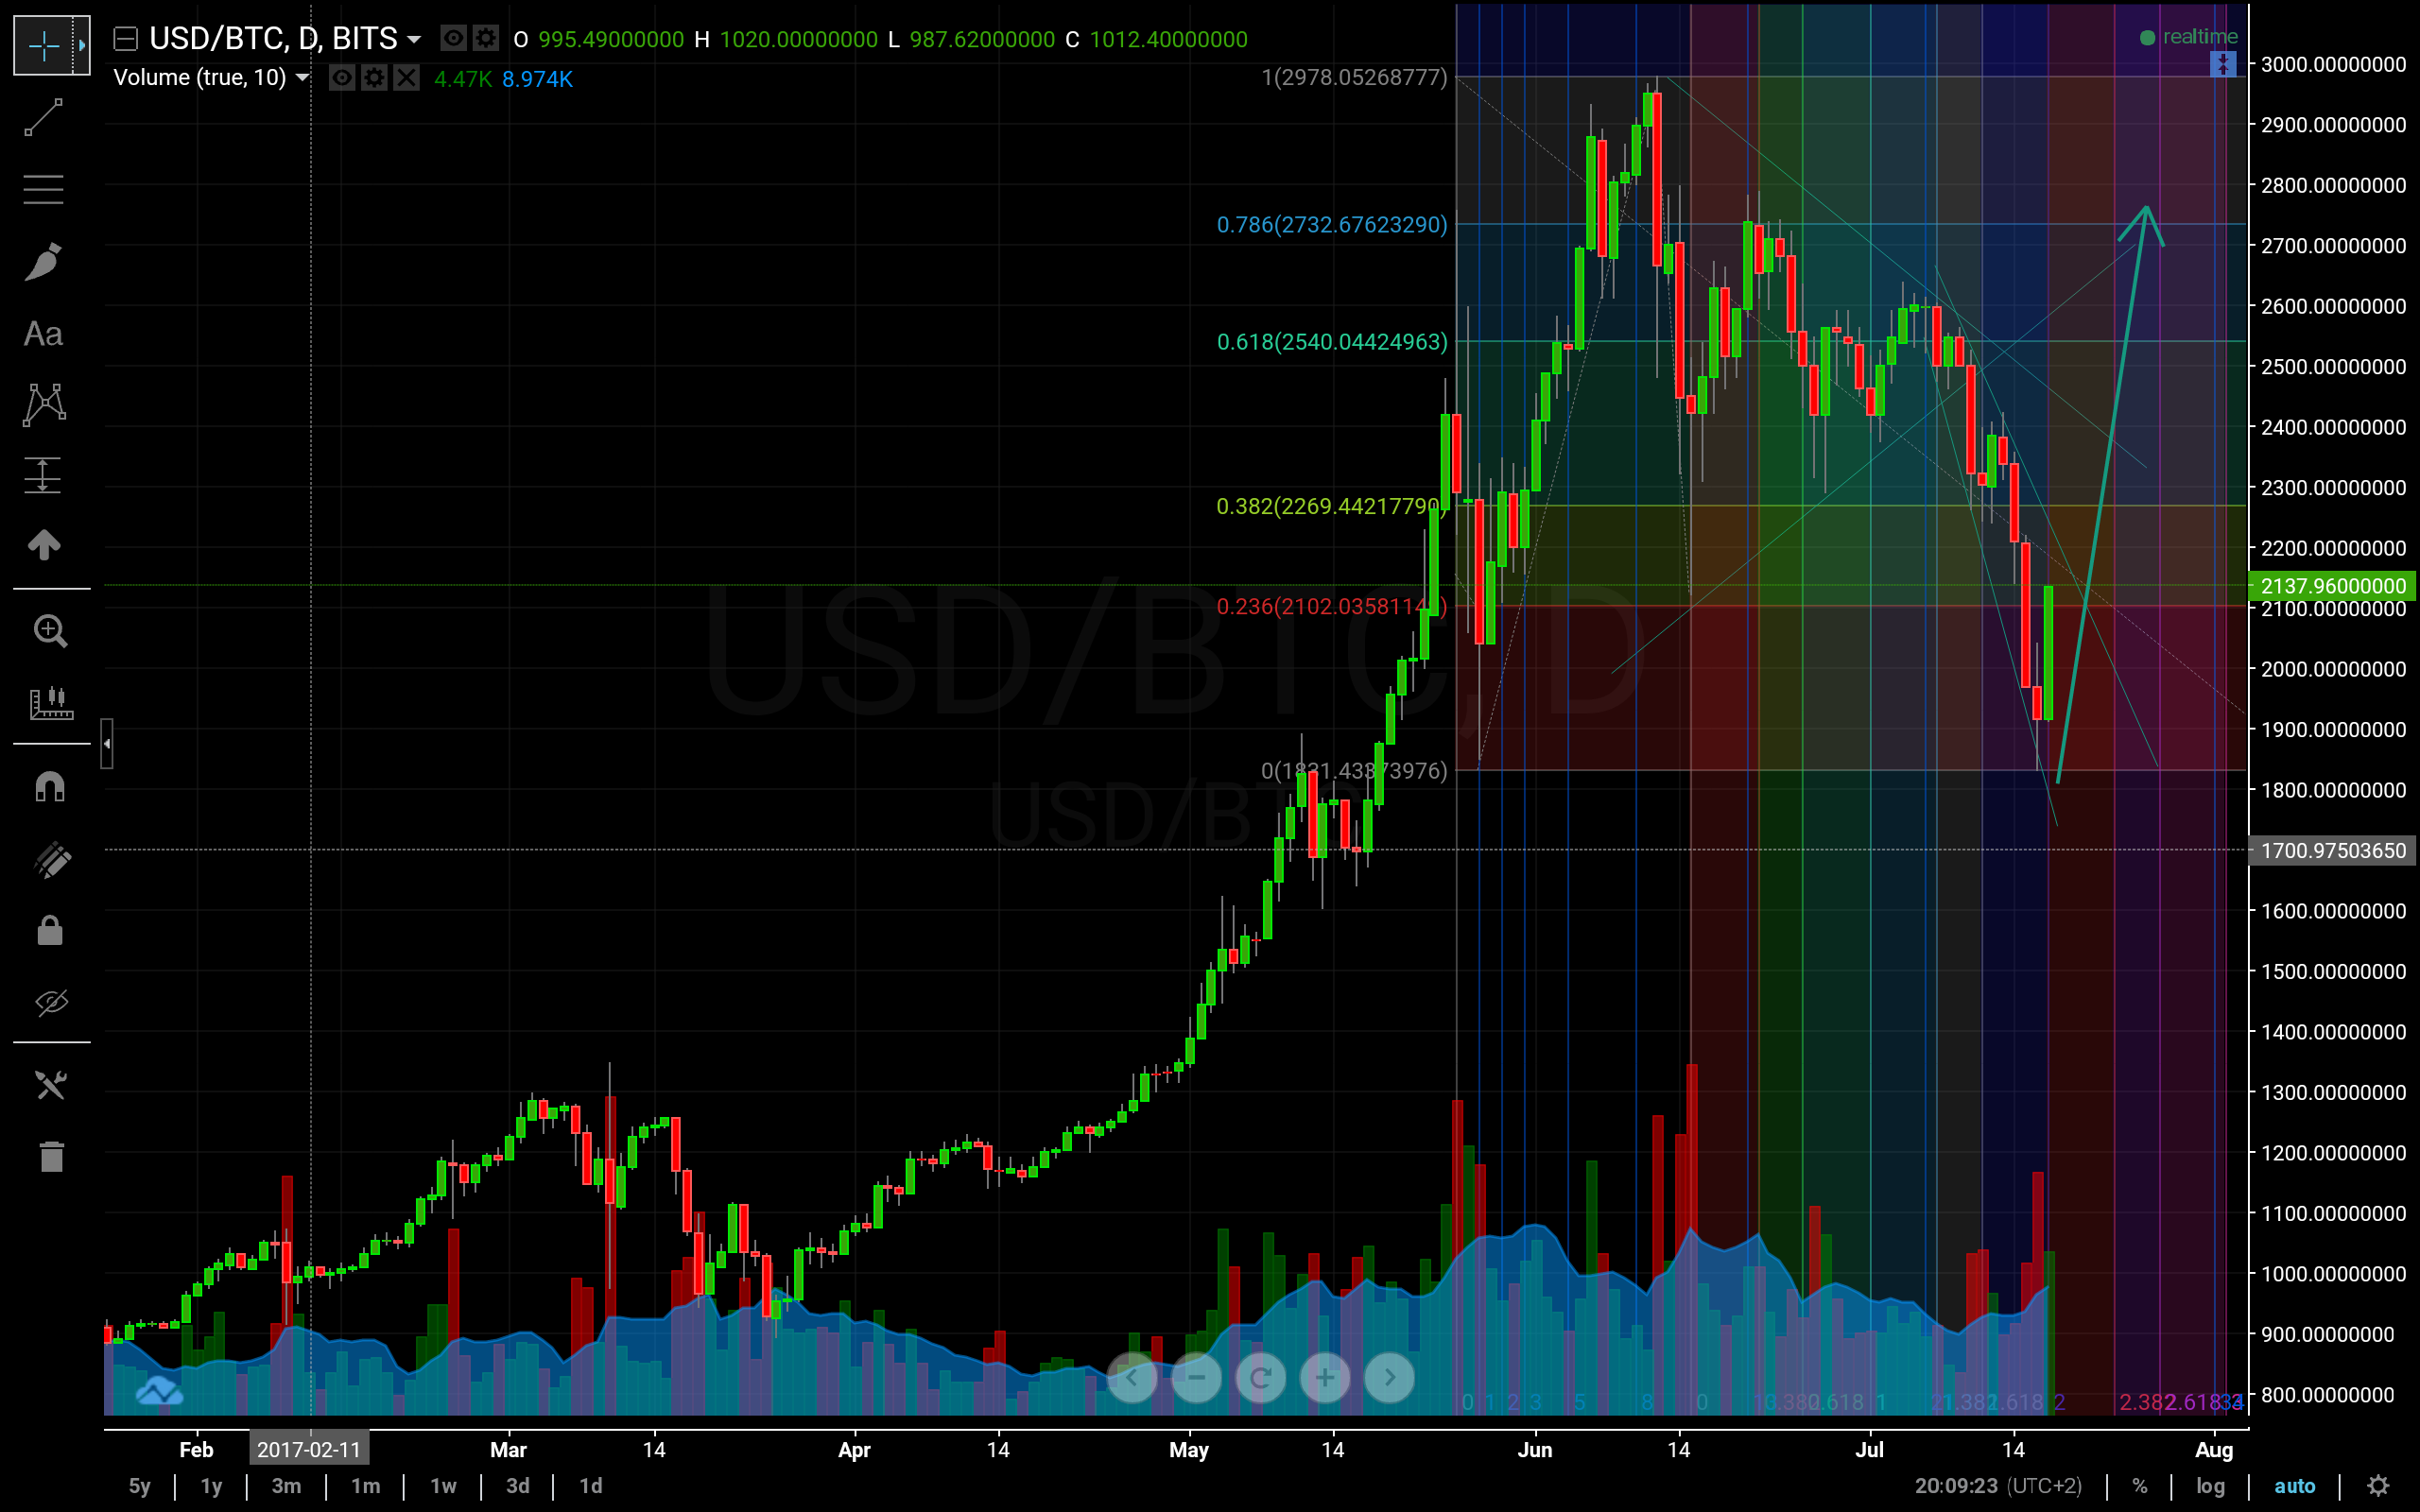
It is now time to consider the new sell levels for BTC. There is an uptrend confirmed by most indicators, including the MACD histogram and the RSI. It is very likely that we will see a rapid rebound now to about $2270, where heavy resistance will be met from the downtrend line and the 0.382 fib. Then a correction to the 0.236 fib at about $2100, before another surge again, with only minor fluctuations up to about $2750 with some resistance on the 50% where the longer term downtrend will also be broken. at $2750 the uptrend will be met and form resistance along with the 0.786 fib and it is unlikely it will be able to move past that for now.
This will probably be able to fit in between now and 1st of August, when things are going to get rather different, with the coming fork. It is highly likely that we will see quite a bearmarket for quite a while after. But it is pretty certain that this pump didn't burn nearly enough steam as the one in 2013/2014 did, and it is highly likely we'll see a pretty crazy pump again in not too long.

Thanks man - where did you learn how to make predictions and read the charts like this? I want to learn and be able to do the same!
Downvoting a post can decrease pending rewards and make it less visible. Common reasons:
Submit
Hey no problem. I've been obsessively reading about and studying fibonnacci tools and market structure. Investopedia is great for learning, but there are many other sites as well. I use coinigy for my charts, since they cover a lot of crypto exchanges.
There is absolutely no guarantee that it will work, but it generally seems to do so. :)
Downvoting a post can decrease pending rewards and make it less visible. Common reasons:
Submit
Thanks man I'll have a look at Investopedia I've been on there a few times before
Downvoting a post can decrease pending rewards and make it less visible. Common reasons:
Submit
great information :D thanks for sharing
Downvoting a post can decrease pending rewards and make it less visible. Common reasons:
Submit
@torjusg
Great writeup!
Keep sharing great content.
THanks!!
Downvoting a post can decrease pending rewards and make it less visible. Common reasons:
Submit
Thank you for your compliment. :)
Downvoting a post can decrease pending rewards and make it less visible. Common reasons:
Submit