BTC/USD still going down. Where to bounce?
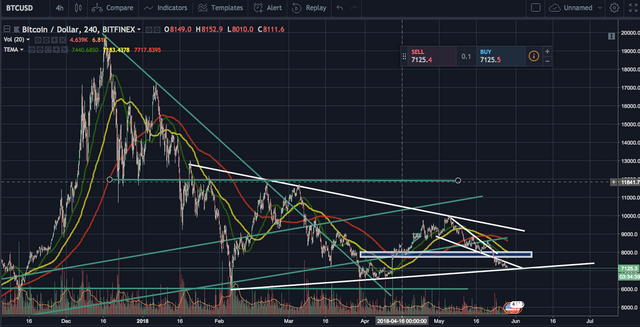
BTC/USD is still going down and the 50 week moving average didn't work as a support line this time. The price is currently testing the lower support trendline of the triangle that I mentioned previously.
As the trading volume (bearish side) is depleting, there is a good chance of bouncing at ~$7,000 USD/BTC level, especially the lower trendline of the triangle (~$7,100 BTC/USD). If the price shows a further dip, then the price might go down ~$6,500 level to form a triple bottom but I think that's less likely but totally possible. Big institutions may add some positions at these levels.

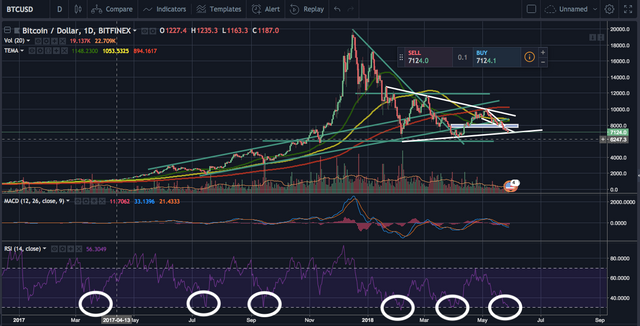
RSI hitting 30
One other important technical indicator to watch is RSI. BTC historically bounces when RSI hits 30, which indicates over sold (of course not always but the chance is high). The white circles show the points where RSI was ~30. You can see that bitcoin often changes the direction when RSI hits ~30.

Please upvote and follow me if you like this post. Also, please leave your comment below if you would like to add something to this post.
Did you want me to do some TA on your favourite altcoins? Let me know down below :)
Where I trade : Binance
Follow me on Twitter : Twitter
Disclaimer : I am not a certified financial advisor. This post is just my personal opinion and not financial advice. Please do your own research and do not trade just based on my posts.