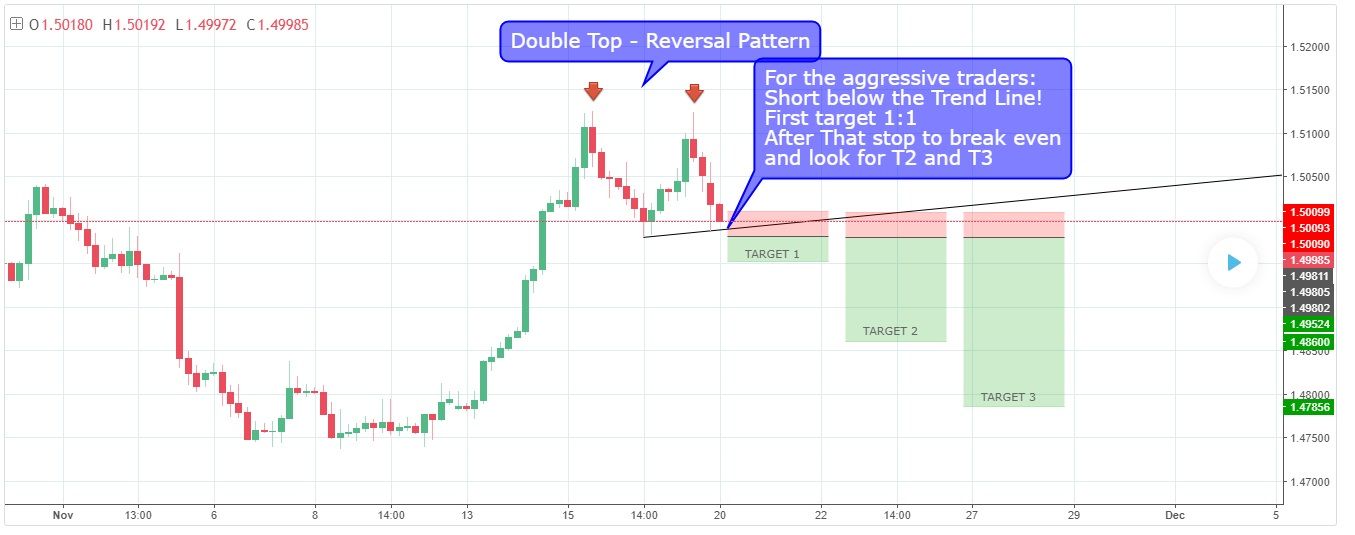
The double top is one of the most popular patterns in trading. It's a reliable reversal pattern that can be used to enter a bearish position after a bullish trend. It consists of 2 tops at nearly the same level with a valley in between, which creates the neckline. The second top does not break the level of the first top, so the price retested this level and tried to make a higher high, but failed. Price breaking the neckline and closing below it would complete the pattern.
Conservative traders look for additional confirmation and aggressive traders may enter a bearish position from the second top. The target can be estimated by measuring the height of the pattern and projecting this downwards from the neckline. Common stop levels are just above the neckline, halfway between the neckline and the tops or above the tops. The double bottom is the bullish version of this pattern that can form after a downtrend.
STOP ** upvoting your own posts!**
I found a upvote/follower exchange that gives you 5X your upvote value(if your a minnow).
Its called SteemFollower in fact,
This post is being upvoted by SteemFollower give it a try.
Follow me Tweeter @EliteTradersPH for more buy signals
I make all buys that I post and I sell at 10% profit
Happy Trading