What is truly amazing about Ethereum Analytics on ethinfo.com is that it provides data backed evidence of all aspects of the blockchain ecosystem. As we're ending 2019 - here are some insights:
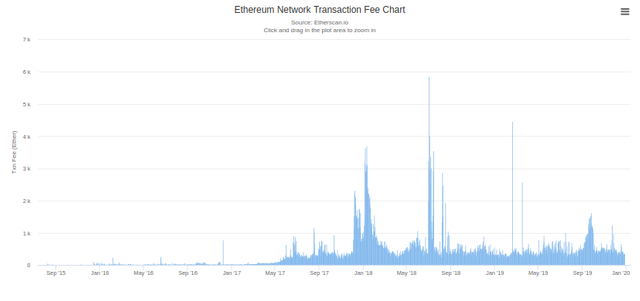
- The network transaction fees has remained mostly constant for all of 2019 except for occasional spikes indicating that there is no surge in the number of transactions happening on the network.

Network fees

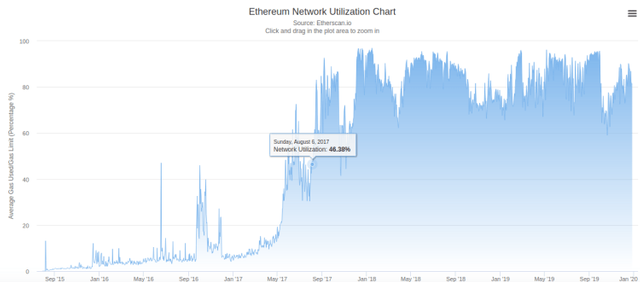
2. The total ethereum network utilization chart shows that the ether network utilization has been between 80 and 100 for almost all of this year, with some instances where the network utilization has been upto 98%.

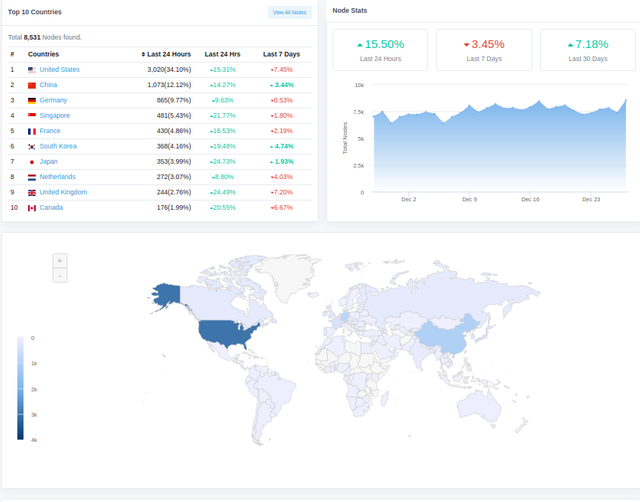
The above image shows how much of the ethereum network is spread around the world. What is interesting to note is that despite the severe ban on "Cryptocurrencies" and other allied technologies in mainland china, there seems to be more than 1073 ethereum nodes active at this point. However, it is likely that these nodes are being run out of Hong Kong's datacenters and not on mainland china. Similarly, India has about 160 ethereum nodes active at this point - despite the legal ambiguity.

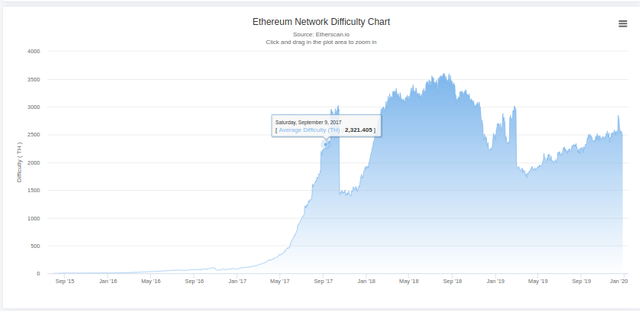
The above graph shows that the overall network difficulty as measured in TeraHashes has continuously increased over the past year.
In conclusion - we have a network that supports cryptocurrencies that is sufficiently decentralized and is bursting at its seams in terms of network throughput with the utilization of about 90% with near-constant/predictable transaction fees. If this network moves toward Proof of Stake and some of the changes such as sharding were to play out on schedule, we will see a significant number of apps being deployed on the global platform.
Posted from my blog with SteemPress : https://www.cryptonewtech.com/2019/12/28/insights-from-ethereum-analytics/