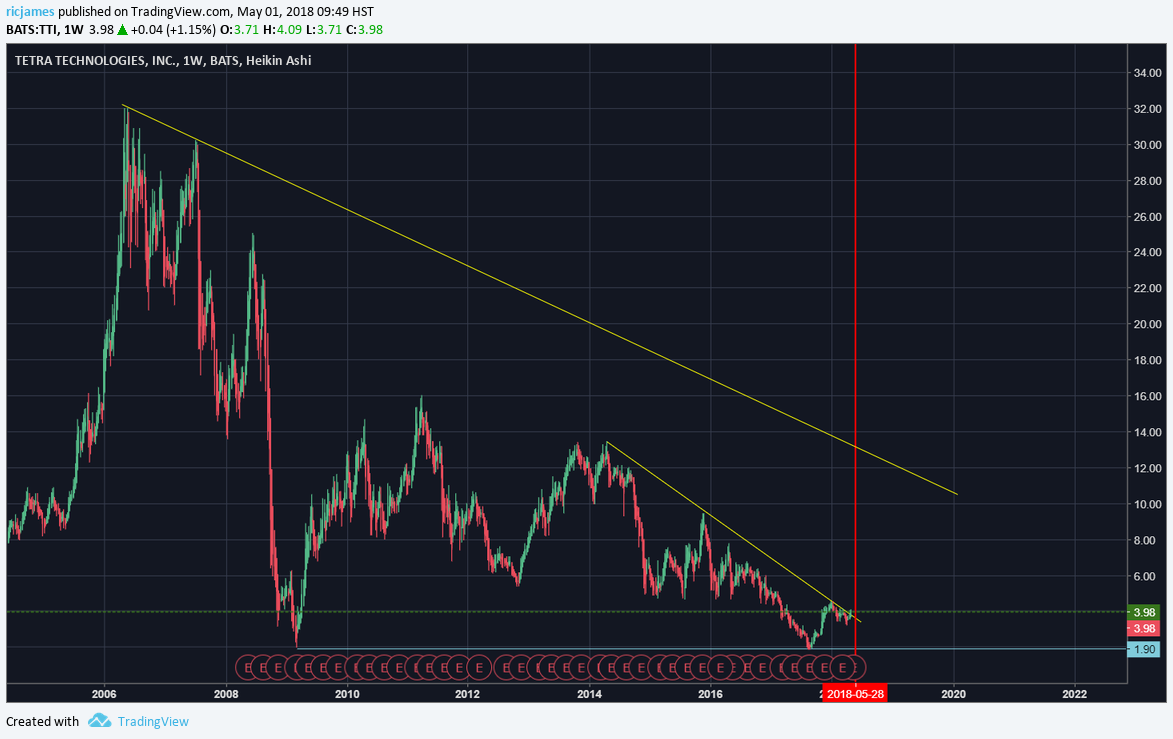
In this post I will go over a stock, TTI (Tetra Technologies), that is primed for a big upward move. To give some insight into what TTI is, it is a diversified oil and gas company that specializes in the transportation of goods. It is a global company which conducts business on 6 continents.
For the last decade TTI has been in a decline with its stock falling from a high around $32 to a low of $1.9 during that time. Currently the stock sits just below $4 and is looking at a big upward move.

Taking a look at the full chart you can see the downward trend that TTI has been in since 2007. I added two trend-lines on the chart to show where the price is looking to head towards. on the bottom trend-line you can see a consolidation pattern hugging the line and a break of the trend-line. This is a very bullish symbol which usually resolves to the upside.
Also if you take a look at the bottom of the chart, you can see a double bottom. This is another bullish pattern where we should see more upside on this chart.

Taking a closer look at this move, we can see how nicely the price bounces off that trend-line. Now what we want to see before we enter this trade is another consolidation pattern where price bounces around the trend-line. If you notice the two vertical red lines on the right side of the chart, those are acting as timing elements. Based off prior lengths of bearish moves, I am expecting to see resolution of this consolidation pattern around those red lines.
The two blue arrows are acting as a channel which is something we would like to see occur. If it starts to create a channel like that it will help validate our bullish feelings on this chart. Based on the timing elements we should see the next impulse move by the end of May.

This is a great buy due to many factors other than just the technical analysis. One of those is that this company deals in Gas and Oil. If you have been following those markets you would know that the price of the commodity has been in a decline since the 2007 crash with little surges in 2012 and 2013. Currently we are looking at a rebound in the gas and oil industry as the prices are starting to rise once again. With the rise in prices we expect to see companies that deal in the commodities profits to rise as they would be able to make larger profits.
So how would you trade this chart?
Look for dips in the price and play the breaks to the upside. One of those is breaks to the upside is going to be one of the big one so just continue to increase your position in it until it breaks to the upside. The one thing you need to watch out for is a break to the downside. If it does break significantly back into the downward trend, it might be heading back down to test that low around $1.90 and you do not want to be stuck in that trade. Set your stop loss and continue to watch this chart as the upside on this stock could be massive.
Follow the rules and wait for the dips this chart should have plenty of upside and a great addition to your portfolio.