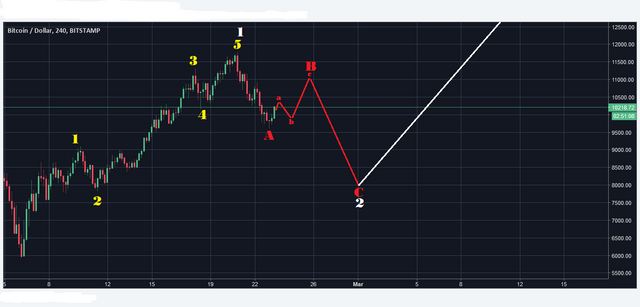
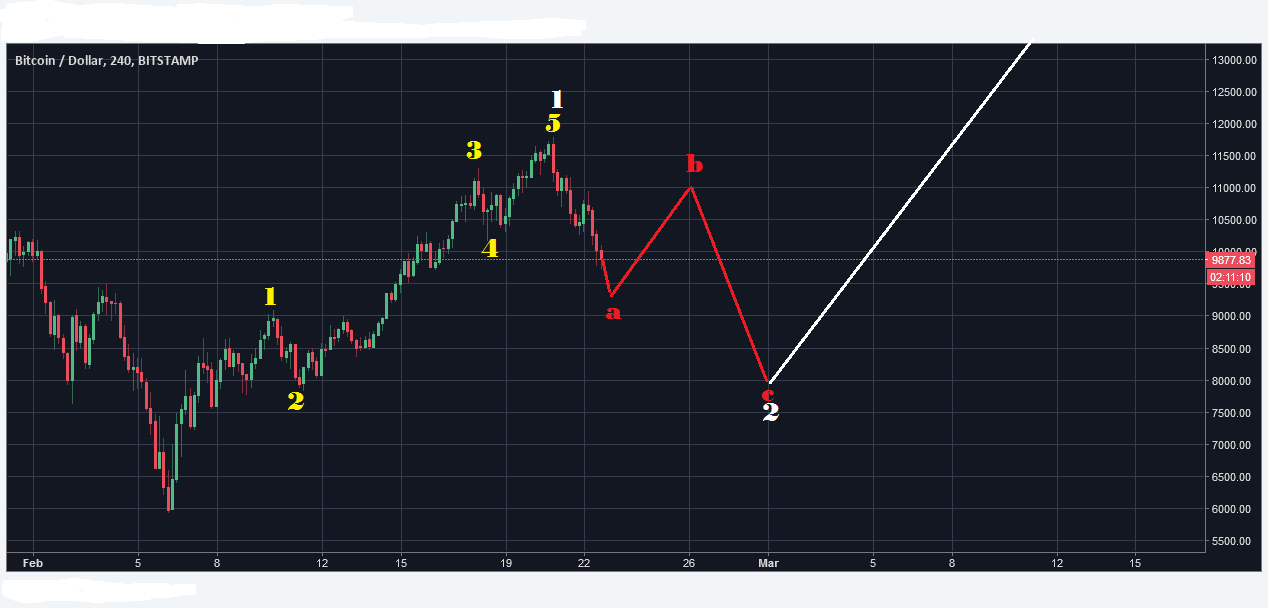
Wave A seems to be done, and we are already seeing wave a of B nearing completion. This wave B will take some time and it will likely be a boring weekend unless wave c of B is finished faster than expected.
Here is the updated count:


Wave B could move higher than shown in the picture, but it doesn't change anything about this count.
Even if it turns out to be the start of a final impulse wave down to my bear target, it will still look close to this until wave B is finished.
.png)
If you think this to be useful information:

.png)
Feel free to use and share my charts, but please mention me, @ew-and-patterns as the author. Otherwise it is considered plagiarism and I will flag you and advise my friends to do the same.
.png)
MUST READ!
DISCLAIMER: This post / analysis serves general information purposes only. I am not, and never will be a financial adviser. The material in this post does not constitute any trading advice whatsoever. This is just the way I see the charts and what my trading ideas (from my personal experiences) are. I use chart pattern and Elliott Wave analysis for my trading ideas.
For full disclosure: The author of this post is holding positions in this market at the time of this post. Please conduct your own due diligence, if you plan to copy anyones investment decisions!
If you make any trades or investments after reading this post, it is completely in your own responsibility. I am not responsible for any of your losses. By reading this post you acknowledge and accept to never hold me accountable for any of your losses.
Please consider leaving a comment, like or resteem, if this post entertained you or helped you see things differently...
Have a nice day :-)
Hopefully we have a little reverse brand and shoulder pattern forming with a bullish motion to follow. Let’s see if March gets things going.
Downvoting a post can decrease pending rewards and make it less visible. Common reasons:
Submit
Good analysis
I share analysis and counting in the graph
I see the bearish wave 1 could rebound at point B of the graph that is a bearish trend line, a bearish wave 2 that could reach 9000 dollars, if accompanied by the volume
to then raise and form the right shoulder of the head shoulder inverted figure.
Around 9,000 dollars there is a good previous support or it could bounce before.
With a subsequent rise confirm figure.
Target $ 18,000.
I await your comment, thanks
Downvoting a post can decrease pending rewards and make it less visible. Common reasons:
Submit
Thanks dear discuss about the cyptocurranecy .I always see your post and follow you..
Downvoting a post can decrease pending rewards and make it less visible. Common reasons:
Submit
Yes this post is very valuable to me but I have to learn it please guidance and support from you?
@ew-and-patterns
Downvoting a post can decrease pending rewards and make it less visible. Common reasons:
Submit
@ew-and-patterns is right on this...
Nice, and that's an objective projection. You have my upvote.
Downvoting a post can decrease pending rewards and make it less visible. Common reasons:
Submit
I hope that you are wrong, but we will see ;) Thanks for your analysis...
Downvoting a post can decrease pending rewards and make it less visible. Common reasons:
Submit
When you try to complete the Bitcoin Price B wave, we can see that altcoin would overcome their resistance level.
Downvoting a post can decrease pending rewards and make it less visible. Common reasons:
Submit
lets see what happen in the next days.
Downvoting a post can decrease pending rewards and make it less visible. Common reasons:
Submit