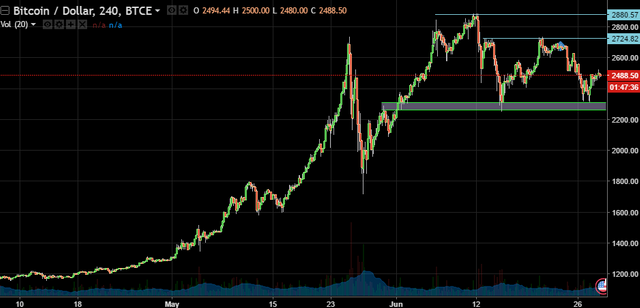
Regardless of the increased volatility over the last few days, the struggle for the $2,300 level did not occur.

Looking at the chart, it can be clearly implied that the price did some retests at $2,300 before going up, which is a rather typical signal for opening long positions. It is relatively low risk.
Bitcoin\Dollar, 240, BTCE

The following scenarios seem to be plausible for BTC/USD:
In the meantime, tests of $2,700, a possible resistance level, might be observed.
Another retest of the $2,300 level. Although not clear, it is still possible. Given a retest takes place, new rooms for deals might occur.
In order to effectively and efficiently invest in cryptocurrencies, you should always closely monitor trading volumes. Admittedly, volumes monitoring provides more valuable insights than mere scrutinizing of the order book.
To recapitulate, long positions from the strong levels would be good deals. Never forget about setting stop-losses! As always, risk/return ratio is a crucial indicator for successful traders.
ETH/USD 29.06.2017
Despite the overall correction of the crypto market, ETH/USD encountered a harsh and severe drawdown. The following pattern is currently persistent with ETH:
The recent $310 support zone has now become a resistance zone. If the $310 level is surpassed and the subsequent retest on volumes is kept, a lucrative point for opening long positions will be set up. Maintaining a close stop-loss level, risk/return ratio might be very promising.
It is quite plausible that there’ll be no surpassing $310 level, against the general up-trend. In this situation, as classic technical analysis puts it, opening short positions might be set up.
Take a moment to consider the $225 zone, which resembles a turning point with a test. Currently, it looks like a strong support level, which is well proved, looking at the historic price movement. This level will be crucial if ETH price proceeds to fall.
Negative news feedback for ETH is an important factor to consider.
Ethereum\Dollar, 240, BTCE

Currently, a struggle for $310, which is a highly vital level, could be observed on the market. Although the price is growing and sometimes the signals might seem to be unambiguous, be attentive when opening short positions.
LTC/USD 29.06.2017
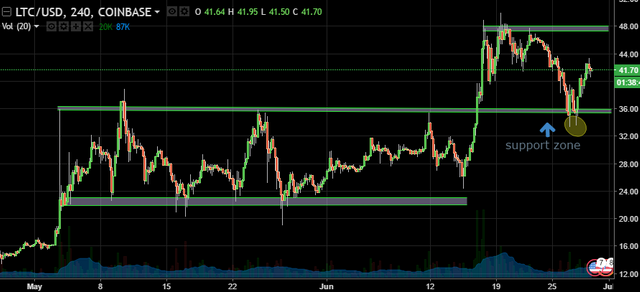
LTC is currently establishing a $36 support zone. Consider the volatility magnitude in proximity to this level - it proves the importance of the retest. If the price merely touches the level and you open the position afterward, stop-loss orders are likely to be executed because of high volatility. However, when the level is tested again, you will be sure about it and the signal will most likely be precise.
LTC\USD, 240, COINBASE

Again, the $36 zone is extremely strong. It is very likely that next month a classical $36-$48 channel for LTC/USD will take place.
At the same time, $48 strongly resembles a resistance zone. So, consider the volumes when opening positions from that zone.
In general, everything looks positive for LTC and the news is positive as well. This is also proved by the $2 bln market cap. It appears that in the near future, LTC might become a good hedge instrument.
Hi! I am a robot. I just upvoted you! I found similar content that readers might be interested in:
https://cointelegraph.com/news/btc-eth-ltc-price-analysis
Downvoting a post can decrease pending rewards and make it less visible. Common reasons:
Submit