In the cryptocurrency world, money flow between different assets plays a significant role in shaping market behavior. Here's a basic analogy to help you grasp the concept, along with key visual aids.
Money Flow Distribution in Crypto Markets
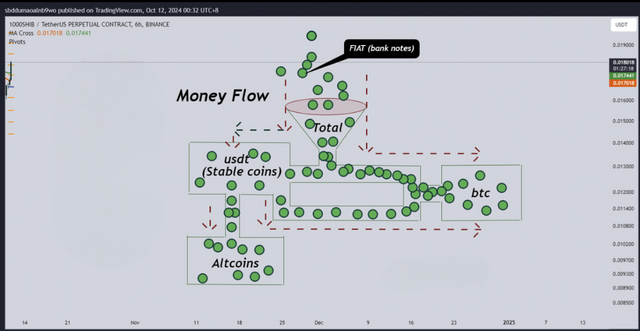
The flow of money into crypto generally follows one of three paths:
- Fiat ➡ USDT (Stablecoins) ➡ Altcoins.
- Fiat ➡ USDT ➡ Bitcoin.
- Fiat ➡ Bitcoin (via Over-the-Counter/ETF transactions).
As more assets flow into the crypto market (fiat to crypto), the total market capitalization increases. This increase affects the dominance of Bitcoin and altcoins, shifting the balance of the market.
Bitcoin Dominance Surges
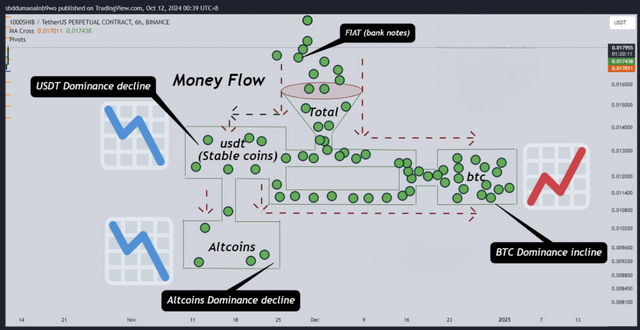
When the majority of inflows go into Bitcoin (e.g., after an ETF approval):
- Total crypto market capitalization increases 📈.
- Bitcoin dominance rises 📈.
- USDT and altcoin dominance fall 📉.
- Bitcoin prices surge, while altcoin prices remain stable or decline slightly.
Balanced Market Between Bitcoin and Altcoins
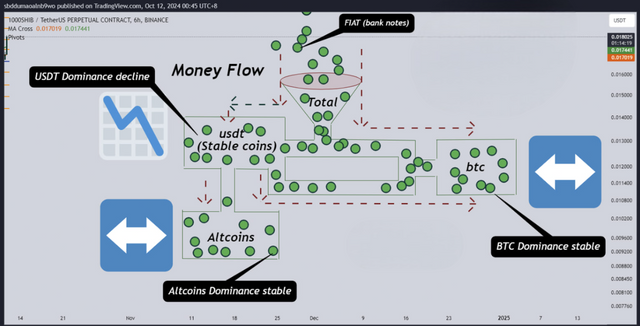
If assets are distributed evenly between Bitcoin and altcoins, we see:
- Stable BTC and altcoin dominance ↔️.
- Both BTC and altcoins experience price pumps 📈, with altcoins seeing a higher percentage increase due to their smaller market cap.
Altcoin Dominance Rises
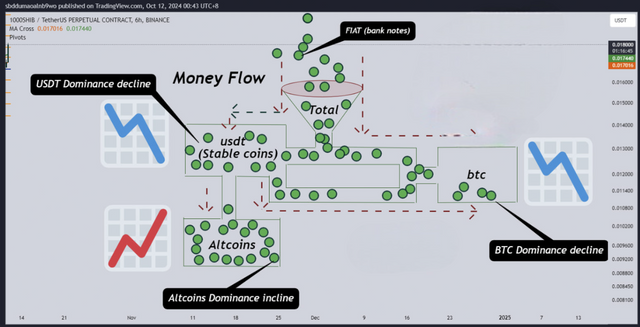
When the majority of inflows go to altcoins instead of Bitcoin:
- Altcoin dominance increases 📈.
- BTC and USDT dominance decline 📉.
- Altcoins rise significantly 📈, while Bitcoin's price remains stable or slightly declines.
Market Sell-off Scenario
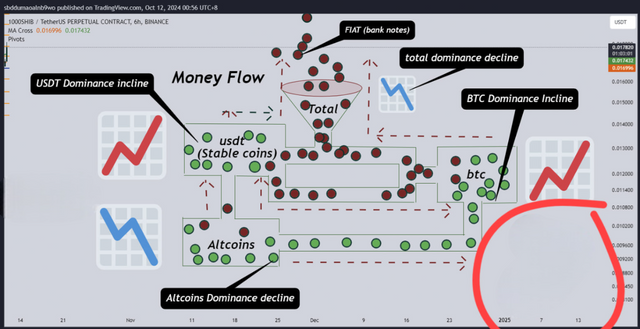
During a sell-off, we see the reverse:
- Total market capitalization declines 📉.
- USDT dominance rises 📈, indicating a shift to stablecoins.
- Altcoin prices drop sharply, while Bitcoin experiences a smaller decline.
Balanced Sell-off
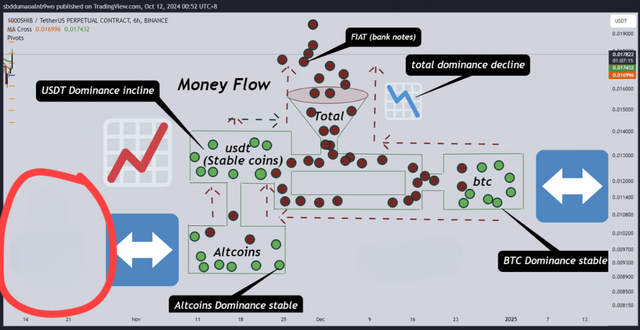
In a balanced sell-off, assets are withdrawn equally from BTC and altcoins:
- BTC and altcoin dominance remain stable ↔️.
- USDT dominance increases 📈.
- Both BTC and altcoin prices fall 📉.
Altseason (ALTSEASON)
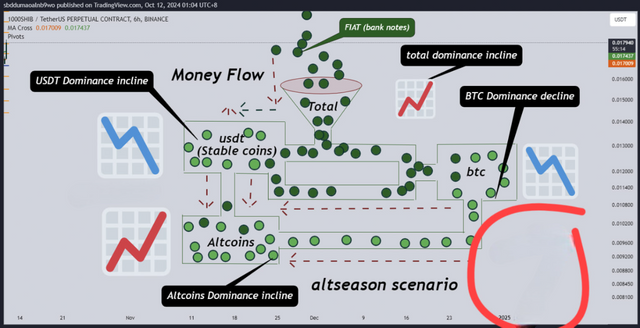
Altseason is a unique phenomenon where altcoins massively outperform Bitcoin:
- Altcoin dominance rises sharply 📈.
- BTC dominance and USDT dominance fall 📉.
- Altcoin prices skyrocket, while Bitcoin remains stable or declines slightly.
Key Takeaways:
- Total Market Capitalization: Represents the total value of all crypto assets, including Bitcoin, altcoins, stablecoins, and meme coins.
- BTC Dominance: Measures the percentage of total crypto assets held in Bitcoin. A higher BTC dominance means Bitcoin is absorbing most of the inflows.
- Altcoin Dominance: Reflects how much of the market is held in altcoins. As this rises, it indicates a shift in money flow toward smaller, riskier assets.
- USDT Dominance: When USDT dominance falls, the market is in buying mode. When it rises, the market is selling.
- Altcoins During ALTSEASON: During altseason, altcoins often see a much larger percentage increase in price due to their smaller market caps compared to Bitcoin.
The Altseason Cycle
Altseason usually occurs when big players (whales) diversify their assets from large-cap cryptos like Bitcoin into smaller, high-reward altcoins. The goal is to maximize returns, and this typically happens near the end of a market cycle. Keep in mind that not all altcoins will reach new all-time highs during altseason, and some may decline before a bear market sets in.
The cryptocurrency market is unpredictable, and while historical data can provide insights, it's essential to stay cautious and manage your risk. The market can be influenced by global events, regulations, and even market sentiment shifts. Always Do Your Own Research (DYOR) and protect your capital in this dynamic space.