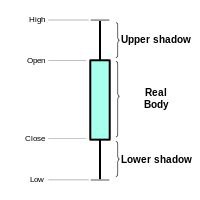
To be a good and effiecient trader you must be able to understand charts of an altcoin,the rising(green candle) and falling (red candle) and it's shadows... candlestick chart is the most common chart used to technically analyze and predict cryptocurrencies price movements. The following exchanges show the candlesticks just as you click on the altcoins; Bittrex, Poloniex,Yobit among others, tabtrader shows a bigger shawdows...
The candle stick are those vertical green and red pillars You See... The shadows are those tiny lines which grows on top(upper shadow) and below (lower shadows)..this shadows helps you know if the price movement will still move upwards or downwards if all things being equal and the altcoins is not being manipulated by that I mean being ARTIFICIALLY PUMPED.
Candlesticks reference the price of each trading session’s open, high, low, and closing positions. As seen in the image attached. As the chart progresses analysts can apply different trend lines and technical indicators to try and predict price movement but in the trading world nothing is for certain. To many extent when the shadow is longer in a particular direction upwards or downward...the price movement tends to move in that direction because it either shows the support level or resistant level. 
Authors get paid when people like you upvote their post.
If you enjoyed what you read here, create your account today and start earning FREE STEEM!
If you enjoyed what you read here, create your account today and start earning FREE STEEM!
Hi follow4follow Vote4vote <3
Downvoting a post can decrease pending rewards and make it less visible. Common reasons:
Submit
https://steemit.com/@sarcasm420 follow me
Downvoting a post can decrease pending rewards and make it less visible. Common reasons:
Submit