The previous indicators were right about the BTC/USD support level. Want to do a quick update on the BTC/USD technical analysis on 2 August 2016.
Cryptocurrency Pair: BTC/USD
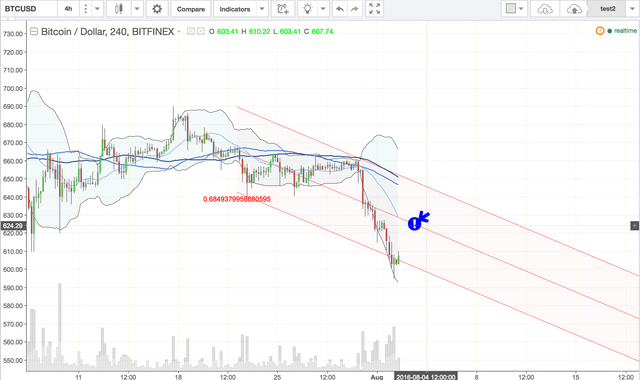
If you refer to my previous post regarding the BTC/USD technical analysis on 30 July, I mentioned that from the indicators that I am using, BTC/USD is trading sideway with the support level at $600 - $ 603.48 Today, we have seen that the price has dropped to that support level and bounced off. So, I would say that the previous indicators were quite accurate. The below is the BTC/USD 4Hours Chart on 2 August 2016.
BTC/USD 4Hours Chart (Medium Term)

Right now the BTC/USD price is about $606-607. It has touched at the bottom line for the Bollinger Bands and also the LRC. It means that the BTC/USD has been oversold. If the technical analysis that I am using is right again, the price should continue its bounce off/upward trend back to the cross of the middle lines of the Bollinger Bands and also the LRC. I have highlighted the area with the blue Arrow in the chart with price range: $624-625. We shall see if the indicators are right within the next few days. ;)
Click my name cooldude ↓ and click Follow, if you don't want to miss any of my analysis.
Downvoting a post can decrease pending rewards and make it less visible. Common reasons:
Submit
Congratulations @cooldude! You received a personal award!
You can view your badges on your Steem Board and compare to others on the Steem Ranking
Vote for @Steemitboard as a witness to get one more award and increased upvotes!
Downvoting a post can decrease pending rewards and make it less visible. Common reasons:
Submit
Downvoting a post can decrease pending rewards and make it less visible. Common reasons:
Submit