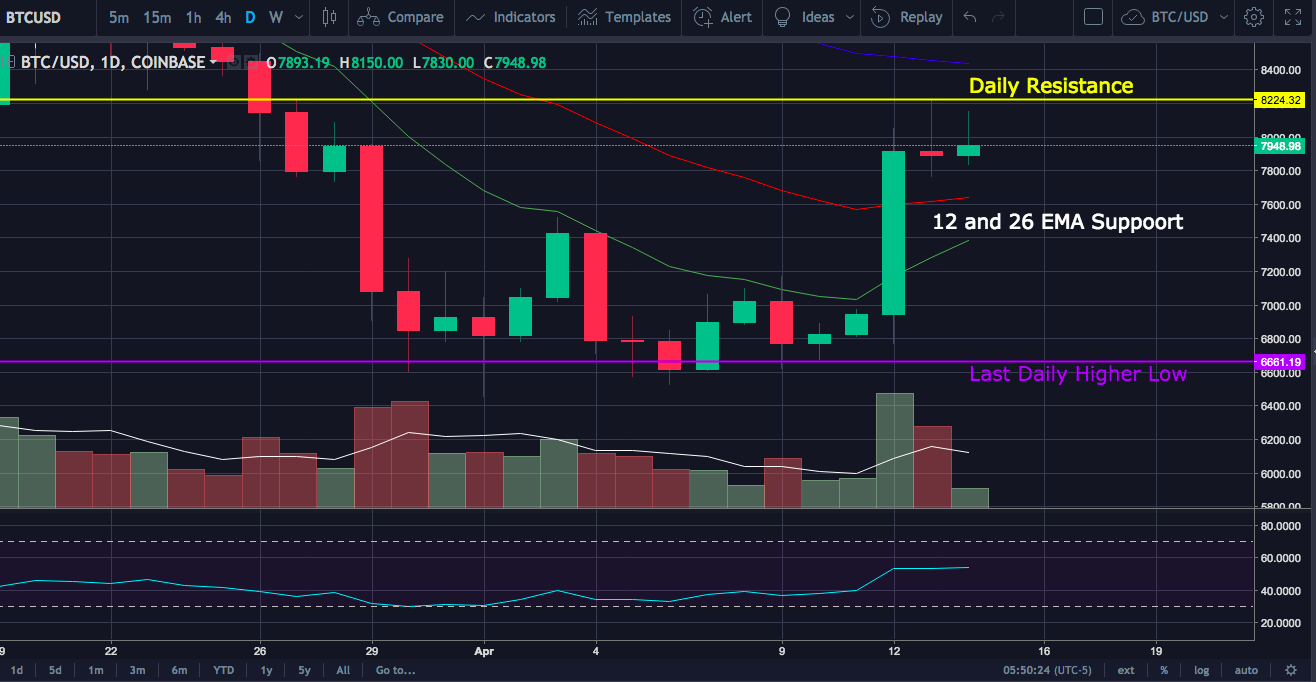
Bitcoin has formed a bearish reversal candlestick on the daily chart with a long upper wick of profit taking. We are now looking for daily consolidation and will look for the daily 12 and 26 exponential moving averages for support. A pullback to the $7500 range would still be bullish and a good sign that the bulls would try to next make a higher high somewhere in the upper $8,000 range on the daily chart. Anything above $6,661.19 would still be a higher low on the daily chart and keep the bulls in control of the daily time frame, although the bulls would not like to see a pullback that far.
Authors get paid when people like you upvote their post.
If you enjoyed what you read here, create your account today and start earning FREE STEEM!
If you enjoyed what you read here, create your account today and start earning FREE STEEM!
Never depreciating it's value
Downvoting a post can decrease pending rewards and make it less visible. Common reasons:
Submit