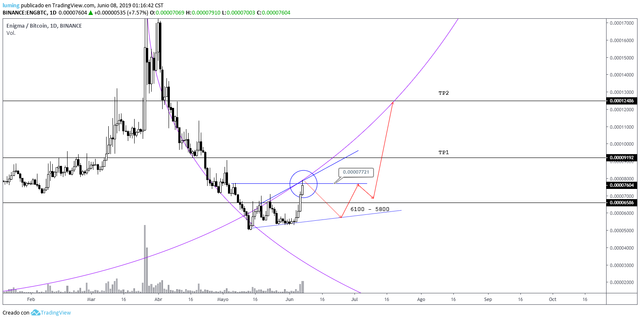

ENG seen from the temporality of 1D we can observe as in the last touch in the parabola, the structure of sails entered in an inverted ascending wedge in which it has respected very well the support of the wedge provoking the recent push of 4 sails alcistas, the current sail is touching a triple resistance, this becomes a strong signal that we will have a correction, another important point to keep in mind in this image is to see how the price has claimed the support of the 6586, we should see that the price makes us a pullback below that zone to finally confirm the reclaim and continue to rise.

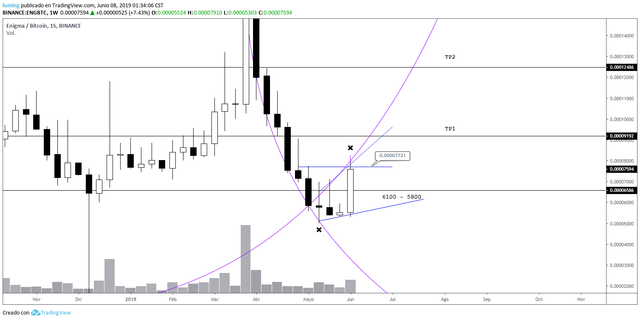
ENG seen from the temporality of 1W we can observe the formation of an ascending triangle, having the resistance located at 7721 where the price is currently being rejected, I have indicated in the image the price range of 6100 – 5800 which is the possible zone to where the price could fall.

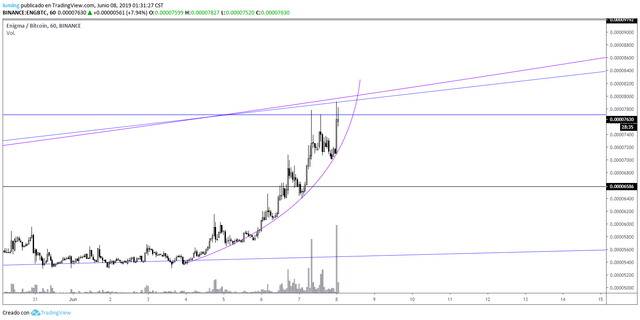
ENG seen from the temporality of 1H we can observe the parabola of growth that has had the price in the last three days, we see as the recent candles begin to show signs of fatigue in the testing of the resistance of 7721, this should support the above, a correction necessary to try the break later.
In conclusion, if the price continues to fail to close above the resistance at 7721, it is very possible that the price has a correction giving us a new entry to continue the uptrend, if the price in 1D manages to close above 7721 with a strong entry of volume we would invalidate the analysis and the price could continue to move rapidly towards our take profits shown in the chart, the first take profit is located at 9192, while the second take profit is located at 12486.
As I always say, you have to be aware of the movement, invalidations can occur, there is no 100% reliable analysis, take your own precautions when trading.
You can follow me on Twitter: https://twitter.com/armijogarcia
Posted from my blog with SteemPress : https://mentormarket.io/cryptocurrencies/mrbullishsail/eng-technical-analysis/