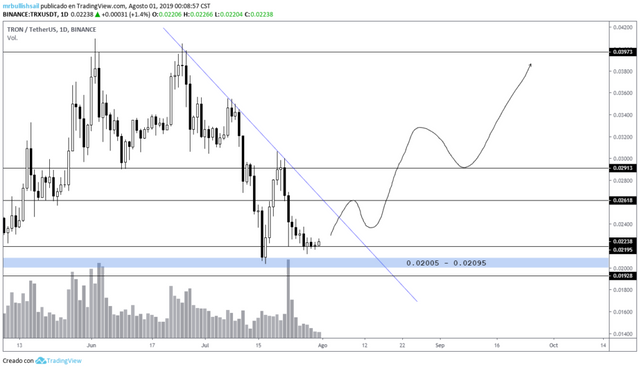

TRX seen from the temporality of 1D we can observe as the price begins to show signs of recovery, we have a consolidation of 4 candles on the support located at 0.02195 where the current candle to continue like this would be creating the second bull candle with flip, this is a very good signal, in the greater perspective we could have a double floor setup that takes us to the possible break of the diagonal fall of the falling wedge, if this happens we would have a setup of adan and eva very well formed that should take the price higher towards the resistance located in the 0.03973, in the graph above I have drawn the possible trajectory that should follow the price in the next few days.

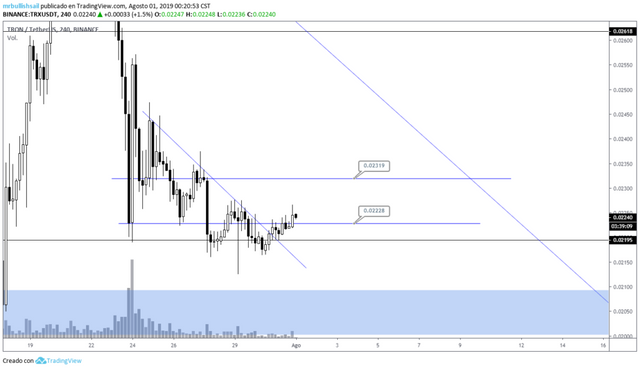
TRX seen from the temporality of 4H we can observe more closely the current movement of the candles, here we have the formation of a bullish setup, the price could test again the blue horizontal located at 0.02228 and then go to look for the test or break of the key resistance located at 0.02319, seeing the major patterns in the first graph, the price should not have many problems in following up, however, never trust 100% of what you see at that time, external factors can occur that radically change the movement of the price, so I always recommend to follow very closely the action of the price of the operations we perform.
In conclusion, the structure of price movement in TRX is showing signs of trend change, the temporality in 4H is confirming the major patterns in the price, an entry at this time seems to be very good, however, if you do not want to risk so much, you can wait for the breaking of the downward wedge in 1D and the formation of an HL above the diagonal fall, such a zone would be ideal to enter long looking for a target above 0.03000, being the resistance at 0.03973, in case the price breaks the support located at 0.02195, the price could fall to the zone of demand indicated in the first graph within a blue rectangle located within the price range of 0.02005 – 0.02095, could even find support up to the horizontal located at 0.01928.
As I always say, you have to be aware of the movement, invalidations can occur, there is no 100% reliable analysis, take your own precautions when trading.
You can follow me on Twitter: https://twitter.com/armijogarcia
Posted from my blog with SteemPress : https://mentormarket.io/cryptocurrencies/mrbullishsail/trx-technical-analysis-2/
Congratulations @mrbullishsail! You have completed the following achievement on the Steem blockchain and have been rewarded with new badge(s) :
You can view your badges on your Steem Board and compare to others on the Steem Ranking
If you no longer want to receive notifications, reply to this comment with the word
STOPTo support your work, I also upvoted your post!
Vote for @Steemitboard as a witness to get one more award and increased upvotes!
Downvoting a post can decrease pending rewards and make it less visible. Common reasons:
Submit