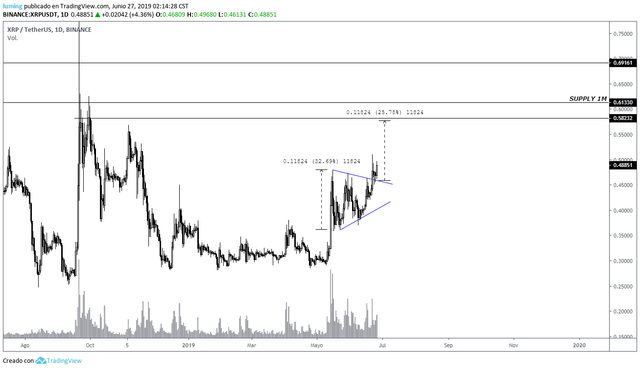

XRP seen from the temporality of 1D we can see how the price has made the break of the symmetric triangle with its subsequent throwback to the support where it has tested correctly to continue to rise, the price should rise to our target indicated in the chart, around 0.57 – 0.58, the price should not fall from the support as this would be generating an invalidation in the movement.

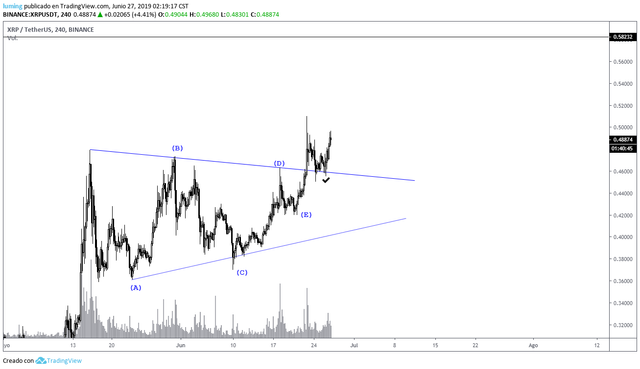
XRP seen from the temporality of 4h we can observe more closely the current structure of the movement, after concluding point E has formed the first bullish wave and then make a brief correction to the aforementioned support forming wave number two, so currently maintains a correct bullish movement that should not have problems to reach our goal.

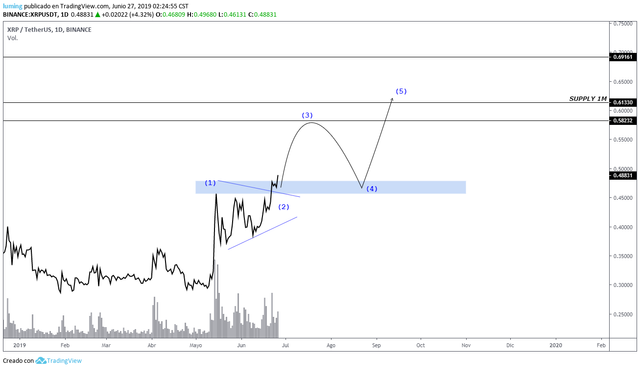
I have made this graph to show the movement of five waves that I currently see in XRP, completing the third wave in our target, we would expect a correction towards the price range of 0.45 – 0.48, this zone of demand should push the price back to the monthly supply zone located at 0.61.
In conclusion, the price maintains a bullish movement, the price should reach our first objective without any problem, however, we must remember that the BTC price is increased a lot in a very short time, this could generate invalidations, therefore, I recommend to be very careful.
As I always say, you have to be aware of the movement, invalidations can occur, there is no 100% reliable analysis, take your own precautions when trading.
You can follow me on Twitter: https://twitter.com/armijogarcia
Posted from my blog with SteemPress : https://mentormarket.io/cryptocurrencies/mrbullishsail/xrp-technical-analysis/