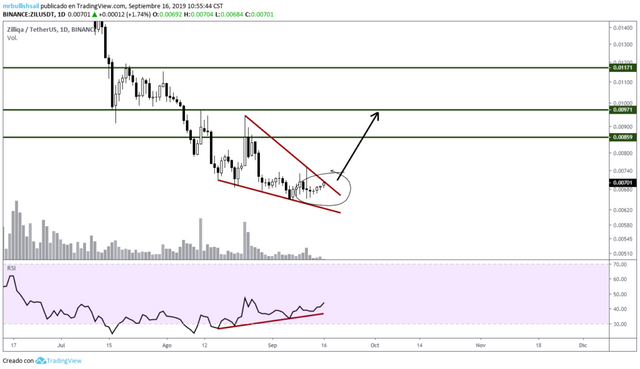

ZIL seen from the temporality of 1D we can observe how the price has formed a descending wedge in which while the price has been contracting, its relative strength has been growing thus forming an upward divergence that is causing the current uptrend of the most recent candles, the odds of the break up are very high, at any time we could have a powerful uptrend, the first target I have located at 0.00859, the second target is at 0.00971 and the third target is at 0.01171, the second target is an important supply level that we must take into account.

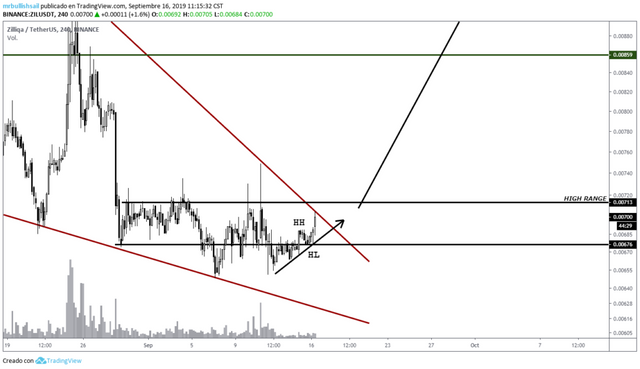
ZIL seen from the 4H temporality we can observe more closely the current movement of candles where the price has formed a new HH and HL above the low range with correct testo, we should see a next bullish impulse very soon, the high range is located at 0.00713, the price should form an HL above that level to continue above.

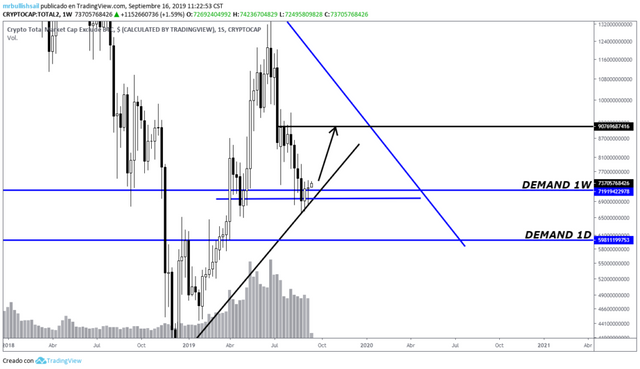
The chart of the alts market is currently quite positive, it has been held on the support diagonally, the weekly candle has closed on important support with lower wick showing buying pressure, we should continue to rise to the supply area indicated on the chart with a horizontal black color and an arrow pointing to it.
In conclusion, the price action looks pretty good, you can easily see the trend that the candles have taken in 1D, prior to a much greater next impulse to which we must be attentive, coupled with the positive situation in the chart of the alts market we could have a break very soon, I recommend to be always attentive to the price action and the movement of BTC, always wait for the break and confirmation to ensure our operations.
As I always say, you have to be aware of the movement, invalidations can occur, there is no 100% reliable analysis, take your own precautions when trading.
You can follow me on Twitter: https://twitter.com/armijogarcia
Posted from my blog with SteemPress : https://mentormarket.io/cryptocurrencies/mrbullishsail/zil-technical-analysis-3/