Those who are HODLING BTC from 60k and expecting it to bounce to their buying price, there is some goodnews for them to watchout for..Read the entire blog to get a fair idea about TA in crypto..Also dont forget to share with your loved ones..
In this post i am talking about WYCKOFF accumulation concepts of whales...Whales buy when there is fear and sell when there is greedy in the market ..So a million dollar question is that when to know there is fear and Greed...///Today i will share the footprint of whales..IF you follow them you would be within 5% of people who actually wins in the market out of 100%..
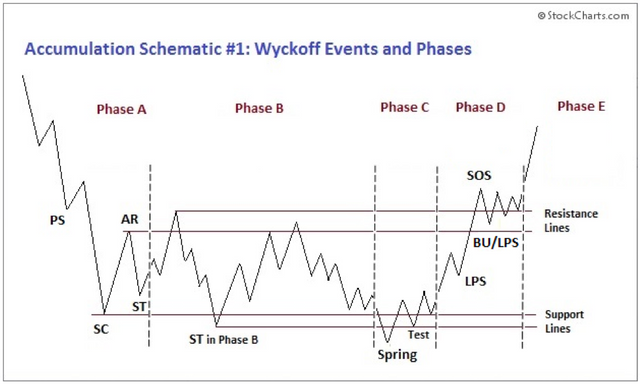
Wickoff accumulation is a pattern which develop in a downtrend market..This represents accumulation of big players before big upmove..I will share a WICKOFF accumulation chart with you..
Before digging into the concept i will share the meaning of every term there..Read them carefully to get the best of it..

There are mainly 5PHASES in a wickoff accumulation chart of bigplayers PHASE A, B, C, D, E
PHASE A Consists
    PS- PRIMARY SUPPORT
    SC- SELLING CLIMAX
    AR- AUTOMATIC RALLY
    ST- SECONDARY TEST
PS--- PRIMARY SUPPORT seen after a prolonged selling period....Where the volume increses and the price spread
widens..signaling that the downmove may be approaching its end..
SC--- SELLING CLIMAX is a period after PS where BIG PLAYERS start selling heavily to force retailers for panic selling..Here
one thing notice that you can get a very good chance to accumulate some BTC when bigplayers selling them..Just
need to find a good longterm support zone there where BIgplayers try to buy near Bottom..
AR--- AUTOMATIC RALLY is seen where shortcovering starts and seeling diminishes ..This will push price easily up ...This is
the region to exit from the trade what you had taken in SC phase..
*** AR also makes the upper range of WICKOFF CHART...So marked it in the chart aswell ****
ST--- In SECONDARY TEST price revisits the area of SC to test support and demand again..
If a bottom is to be confirmed then VOLUME and PRICE spread should be low near SC{This is important}
******MULTIPLE STs CAN BE FORMED AFTER ONE SC********
PHASE B
           IN phase B price once try to break the upper range of wickoff chart but failed ..which also makes the upper range
           of the chart as shown in the diagram  {THE RANGE BETWEEN AR and TEST OF AR IN PHASE B MAKES THE UPPER
           RANGE}
                                 Multiple STs can be seen in PHASE B as discussed above..
PHASE C
PHASE C also called as SPRING / SHAKEOUT PHASE ..where Bigplayers try to demotivate retailers by testing the
lower level again and again..Here price goes down below SC whcih is the support zone of the WICKOFF CHART
and suddenly bounce back and immidiately closes above the range...Here price spread becomes lower as there
are not as many sellers as before..THIS IS A SIGN OF BIG UPMOVE
PHASE D consits of
             LPS---LAST POINT OF SUPPORT
             SOS--- SIGN OF STRENGTH
             BU--- BACKUP
SOS- SIGN OF STRENGTH always occurs with increasing spread and high volume with a good uptrend
LPS- LAST POINT OF SUPPORT is the level of support which previously acting as resistance ..Here low spread and lower volume occurs due to weakness in selling pressure..
PHASE E is the initial stage of uptrend which occurs after big accumulation phase'......
SO currently as of writing the date is 1st of SEP 2021 and we are now in PHASE D ...where small dips will occur which should be brought back easily ...this is the initial stage of uptrend so hold your breath HODL your BTC and hope for it to complete the WICKOFF CHART for bigger upmove..
IF you like the post upvote it
IF you want more like this in future then Follow me.
IF you want to support me then please upvote and share with your loved ones
...
A BIG THANK YOU to all of you and apply this in your trading ..This will help you to gain immense profit .....I have many more like this which will come in future soon