It seems with the surge of newer crypto investors that a little info about reading charts could be helpful.
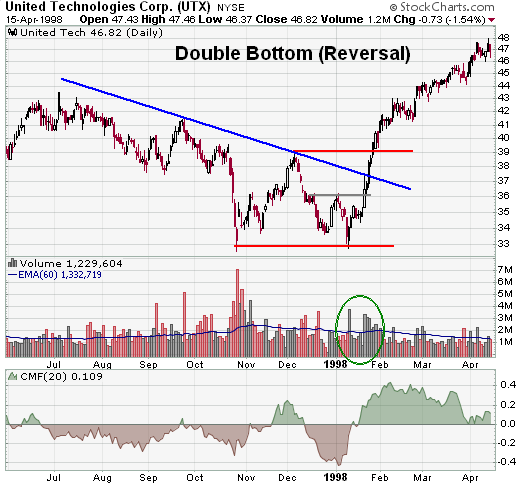
The following describes what is known as a "Double Bottom."
A double bottom is a charting pattern used in technical analysis. It describes the drop of a stock or index, a rebound, another drop to the same or similar level as the original drop, and finally another rebound. The double bottom looks like the letter "W". The twice-touched low is considered a support level.

The double bottom pattern always follows a major or minor down trend in a particular security, and signals the reversal and the beginning of a potential uptrend. Consequently, the pattern should be validated by market fundamentals for the security itself, as well as the sector that the security belongs to, and the market in general. The fundamentals should reflect the characteristics of an upcoming reversal in market conditions. Also, volume should be closely monitored during the formation of the pattern. A spike in volume typically occurs during the two upward price movements in the pattern. These spikes in volume are a strong indication of upward price pressure and serve as further confirmation of a successful double bottom pattern.
Please remember to follow and upvote! Have a blessed day!
Enjoy the vote and reward! Mutual Upvote you :) Follow and Upvote you.
Welcome ! Thank you .
Downvoting a post can decrease pending rewards and make it less visible. Common reasons:
Submit
got you!
Downvoting a post can decrease pending rewards and make it less visible. Common reasons:
Submit
Hi! I am a robot. I just upvoted you! I found similar content that readers might be interested in:
https://www.investopedia.com/terms/d/doublebottom.asp
Downvoting a post can decrease pending rewards and make it less visible. Common reasons:
Submit