Greetings steemit community,
we recently joined steemit and before we start anything we want to introduce ourselfs. This post aims to provide you with an overview of Wavescap, our goals and our features. How can https://wavescap.com help you in your daily crypto life? Enjoy finding out while reading!
What is Wavescap.com?
Wavescap.com is a source of information for the Waves ecosystem. What started out as a token overview for the growing number of Waves based tokens has evolved to an extensive source of ecosystem information. In the following we want to present you the features of wavescap.com and how to use them.
Waves Token Overview
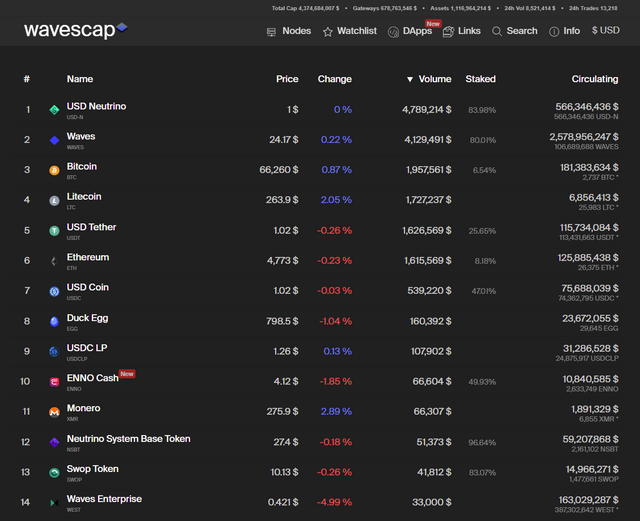
The initial feature on our launch in April 2019 was the token overview for Waves based token. Until today it is the landing page of wavescap.com. On default settings the tokens are sorted after trading volume, but you can also order them after price change, % of tokens staked or marketcap.
The trading volume includes only waves based exchange operation of any kind. This includes exchange transactions on the Waves blockchain, swop.fi exchanges and waves.exchange. The goal is to implement any Waves based exchange platform.
On top of the website you will find 5 metrics which give you a general impression about the current volume of the ecosystem. Total Cap shows the value of all waves based assets and gateway assets combined. They are also showed seperately. The 24h Vol shows the trading volume across the entire waves blockchain. The metric 24h Trades shows the number of exchange transactions executed to the waves blockchain.
Token Detail Page
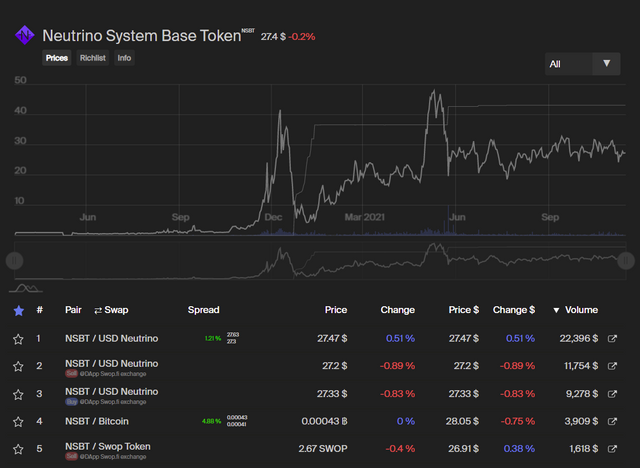
Every token has a detail page which you can find at wavescap.com/asset/[ticker], for example https://wavescap.com/asset/NSBT. There you can find a chart which shows three different graphs.
The big grey line shows the price, the thin grey line shows the circulating supply and the blue bars show the trading volume. Via the dropdown menu in the top right corner you are able to choose between 7 pre-defined timeframes (1 day, 1 week, 1 month, 3 months, 6 months, 1 year and complete history), but you can also set any custom timeframe by moving the regulators below the chart. Below the regulator bar you will find a list of all active trading pairs. You can freely order the list by any listed metric. By clicking on the "swap" button you can swith the price asset and amount asset, so you are able to choose the kind of display you prefer.
The metrics shown include the spread of all shown pairs. It also shows the best bid and ask orders, so you dont have to open waves.exchange in order to see at what price the best bid and at what price the best ask is. The spread numbers are coloured (green = good, red = bad) and show you how reliable the price of that exact pair is. A high spread usually indicates very low trading volume and thus a not very reliable price. The lower the spread, the more reliable is the price.
By clicking on the link icon at the right end of each row you directly get forwarded to the very waves.exchange trading pair you just clicked.
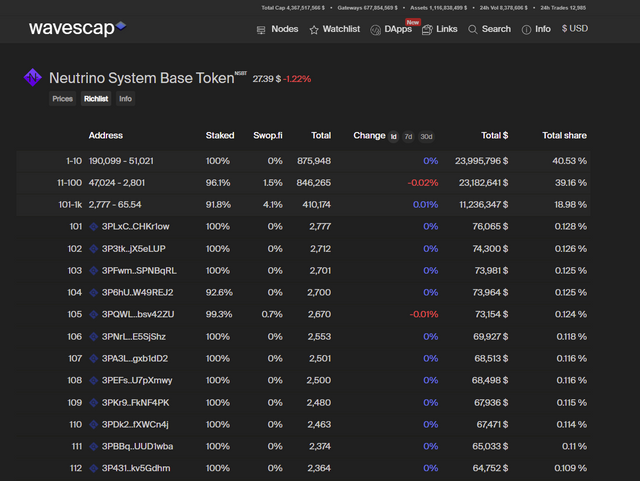
If you click on the richlist tab below the token name you will see one of our core features. We show the Top 1000 addresses for every token we have listed. For the rest we just provide some general statistics to show the distribution of the coin but in order to provide you with a good performance we currently cant load more then the top 1000 addresses from the blockchain. With the richlist you can see how different groups of holders are acting. Are the top wallets accumulating more? Are they dumping? Who are the top wallets? Our richlist feature helps you to answer all of those question. You can see short term as well as long term changes in holders stake, just use the 1d, 7d or 30d button to adjust the timeframe.
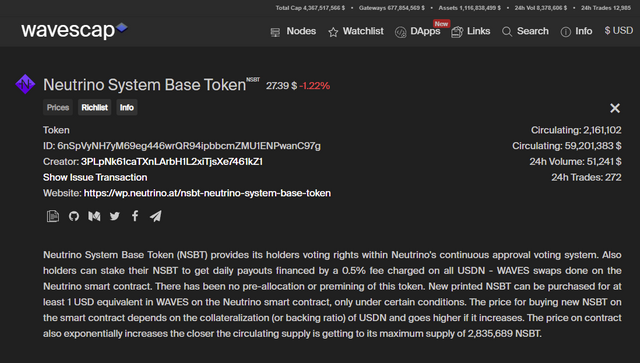
The info tab will provide you with some basic information, such as social media links, a brief description of the token as well as the general token metrics.
Waves Node Overview
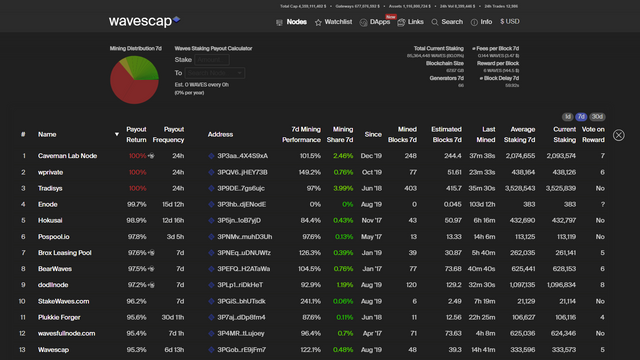
In addition to the token overview we also developed a node overview which you can find at https://wavescap.com/nodes.
In the top right corner you find some basic network stats, such as the total staked amount of Waves in the network, the number of generators (nodes) and the current size of the Waves blockchain. We also show the block delay, the average fees per block with the dollar equivalent and the current block reward in waves and dollar.
We list all nodes who generate blocks but not all of them are nodes with a public presence. For those where we have a name we provide it. If you find a node in our list which we have not assigned a name yet feel free to contact us at [email protected] .
Beside the basic node metrics such as the nodes name and address, the number of mined blocks, the number of estimated blocks, the performance ratio (minded blocks divided by estimated blocks) as well as the last mined block. The current and average staking numbers give you an impression if a node gained or lost generating power in the selected timeframe. We also show for what block reward the nodes are voting. The current block reward is 6, but nodes are voting for block rewards ranging from 4 to 20 Waves. If you want to influence the block reward within the Waves ecosystem you can have impact on that by leasing to a node voting for your favour!
But we dont want to only provide the standard informations, we want a deeper insight. Thats why we started a bot who tracks every node with a public payout scheme. This way we are able to determine payout frequency and payout ratio. We dont rely on third party informations for this, we track all of it by our own. The small token symbol next to the payout ratio number indicates if a node is paying out additional assets (for example node tokens or other leasing incentives). Those assets are not included at the payout ratio. The payout ratio solely shows the mined Waves vs. distributed Waves metric.
Some of the numbers are coloured. Red numbers indicate a risk for the network. Green numbers indicate an increase of decentralization. Try to consider more metrics then just the payout ratio when it comes to selecting a node. Always remember that a strong and decentralized network in the long run will gain more value then a rather centralized network which pays out a few more % in the short run.
Waves Staking Calculator
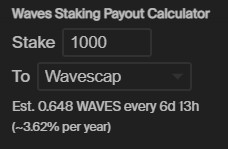
Within the node overview we also provide you with a handy tool, a Waves staking calculator. The benefit with our Waves staking calculator is that we use the payout information we gather in the node overview. This means you can select any node from the dropdown menu, enter any amount of Waves and you will be shown how many Waves in what frequency you roughly can expect.
Waves dApp Overview
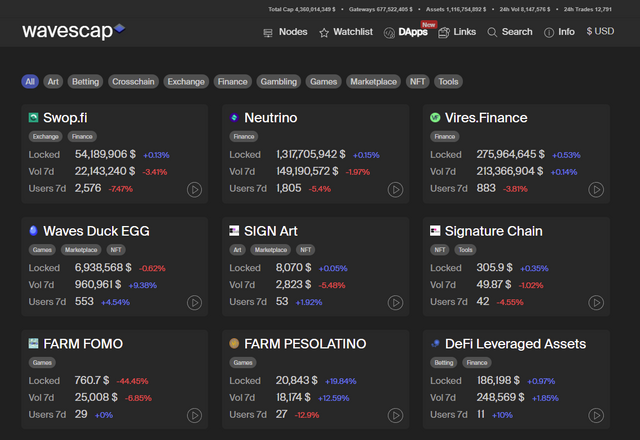
One of our latest releases was our reworked dApp overview. You can find it at https://wavescap.com/dapps.
Similar to the token overview you are presented with a short overview of all Waves based dApps. On the general overview you see the most important numbers for every dapp such as the dollar value of all locked assets in this smart contract, the dollar value of all transactions related to the dApp and the number of users. All dApps are also assigned with one or multiple tags which allow you to filter for specific categories, for example finance or art. By clicking on the play button you get forwarded to the web frontend of the dApp. If you click on a tile you will enter the detail overview.
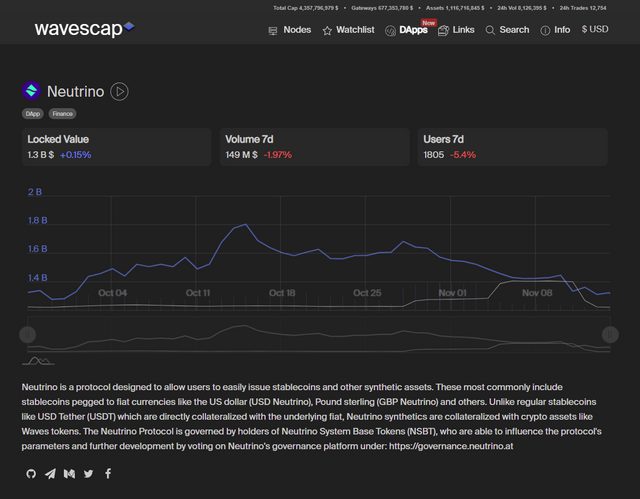
dApp Detail Overview
In addition to the numbers already shown on the general overview you find a chart similar to the token chart. It also features three graphs: The blue line indicates the total locked value, the grey line indicates the amount of users and the bars indicate the volume.
You are also provided with a short description of the dApp and all relevant social media links.
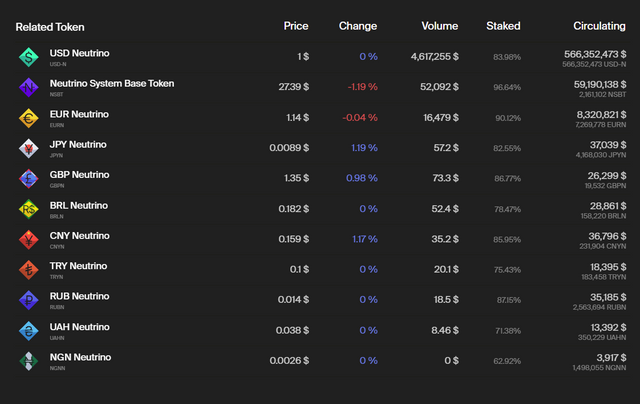
Related Token
If you scroll further down you will find a list of all tokens which are related to the dApp. This means the dApp address or an associated address has issued these assets or they are commonly used within the dApps smart contracts.
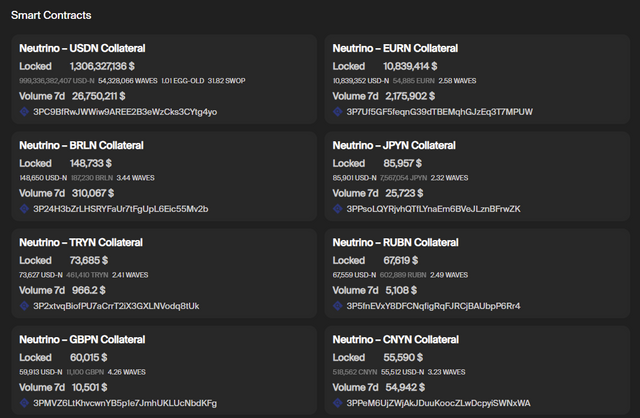
Smart Contracts
There also is a list of all smart contracts used within the dapps.
We not only show the addresses of the said smart contracts but also how many of which asset is locked on the address and what dollar value this means. We also show the volume for each individual smart contract. You can also click on the explorer logo to reach our own block explorer https://wscan.io/ and further analyze the smart contract addresses. We will present wscan.io to you in a seperate post.
We also pland to widely expand the dApp metrics we show. We are already working on even more usefull data to show. Stay tuned!
Link and ICO database
Another major focus is our knowledge database. It consists out of two parts: usefull links and Waves icos.
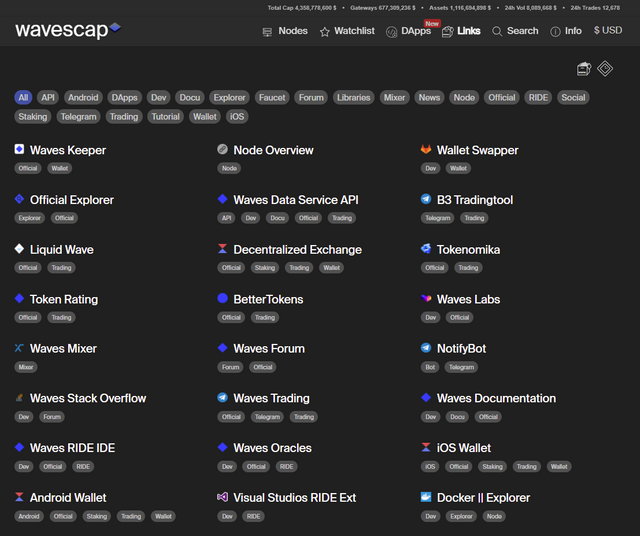
The link database
The database features all kind of usefull links from the waves ecosystem. You can find it at https://wavescap.com/links. Links to tutorials, wallets, usefull telegram bots and much more can be discovered. Similar to the dApp overview the links are assigned tags so you are able to filter the dapps and browse through the group of links you are primarily interested. You can combine as many tags as you want.
If you want your resource in our link list just write us an email to [email protected] and we will add it if it complies with our quality standard.
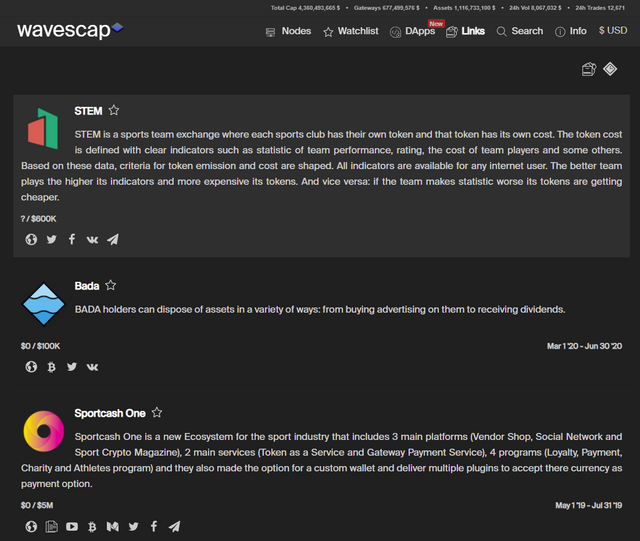
The ICO database
You can find the ICO database at https://wavescap.com/ico or by clicking on the symbol in the top right corner.
Today this servers mainly as an archive for ICOs and IDOs conducted on the Waves Platform. We show the funding goal and raised amount, if publicly accessable. Also the start and end date of the sale as well as helpfull links related to the project.
The Watchlist
Did you knew you can not only add tokens but also ICOs to your watchlist? If you click on the watchlist tab you will find one tab with all your bookmarked token and another one with all your bookmarked ICOs!
More Features
We already presented you our main features but we also provide you with a few more things which might be usefull for some of you.
Wavescap Node
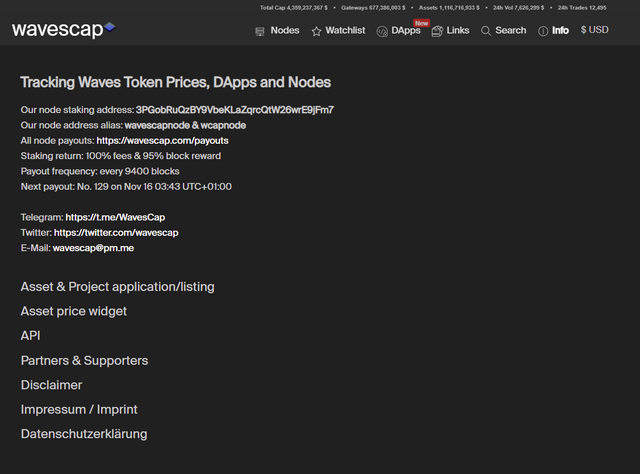
If you visit https://wavescap.com/info you will first find informations about our own node.
We are running our public node in a very reliable way since summer 2019. On top of the mainnet node we also run a testnet and a stagenet node to become involved in active testing and this way supporting the evolution of the network. Payouts are distributed once a week. We pay out 100% of the fees and 95% of the block reward. The remaining 5% are used to maintain our nodes and contribute to Wavescap expenses. If you want to support Wavescap in any way, leasing to our node might be the most effective one. While you donate a small fraction of your leasing income you not only help us, you also help the network because you contribute to financing our test- and stagenet nodes aswell.
If you want to lease some of your waves to us you can lease to 3PGobRuQzBY9VbeKLaZqrcQtW26wrE9jFm7 or our alias wavescapnode. We appreciate every kind of support!
Widgets
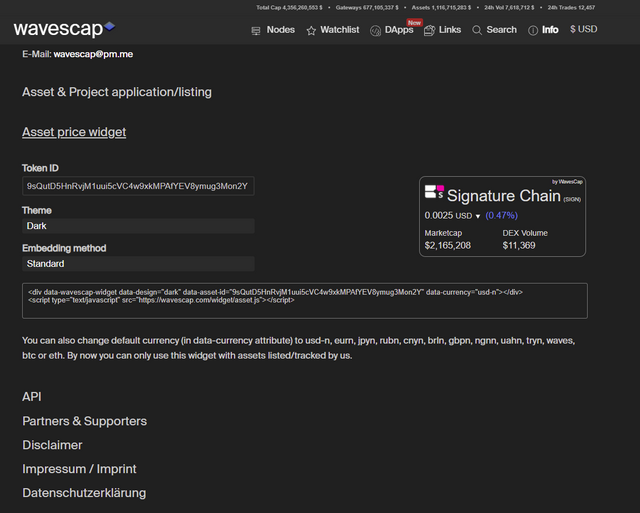
We also offer widgets for all listed tokens.
Just fill in an asset ID from any asset listed on wavescap and then you can embed the widget to your website!
Wavescap API
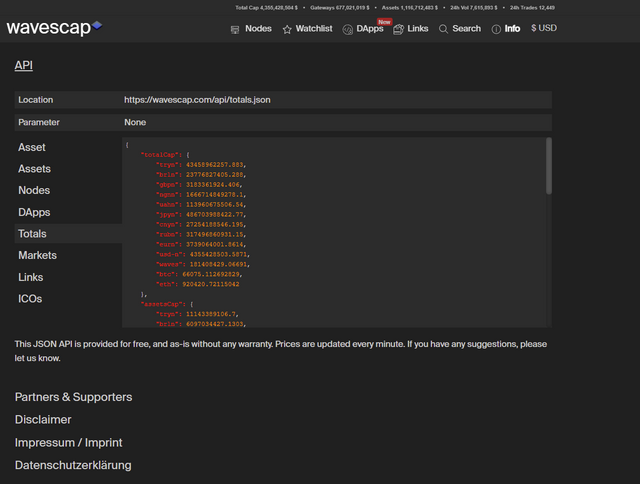
Most of our data is freely accessable via our own API.
We want to increase decentralization and this is why we aim to become a community driven data provider. We want to give other people out there the opportunity to build on top of our project and thus create a truly decentralized ecosystem. If you struggle or have problems with our API feel free to join our telegram community and ask for help. You can join via this link https://t.me/WavesCap.
Outlook
We want to implement even more features and create infrastructure with a lot of depth for the waves ecosystem. We came one step closer to this by releasing our own explorer https://wscan.io/. We will soon present wscan.io in a similar post. This and more things are waiting! Great times ahead for everybody in the ecosystem! Stay tuned!
Links:
wScan - Waves Explorer
Wavescap - Waves Tokens, dApps & Links
Wavescap Official Telegram Group
wScan Twitter
Wavescap Twitter
