Thoughts on the market
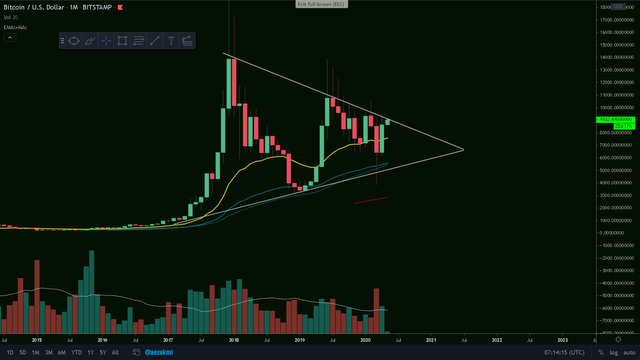
This Bitcoin cycle we're in is slowly approaching an end - and here is a simple chart that says it all. We are once again at the top trend line of the symmetrical triangle and if the monthly candle is closing above 9200$ we're out. A new cycle begins. At the other hand, closing below the 9200$ level gives us a high probability for BTC to retest the lower trend line, at around 5500$. The chart is below.
Candle body, not wick!
Keep in mind that I said "closing the candle" above 9200$, not just having long candle wicks like the ones we had on December 2017 or June 2019.
Targeting an entry
In anticipation for this being just a fake brake-out or a bull trap, I wrote my previous article, where I reveal my exact target to enter a short position.
Ctrl + Click here to enlarge the image in a new tab (steemitimages)

What's your opinion: do we close the May candle above $9200 or we remain inside the triangle?


Thanks for reading and safe trading!✌
If you find this post useful, please:

I'm sure it will even be above 10,000$. Better days coming up
Downvoting a post can decrease pending rewards and make it less visible. Common reasons:
Submit
You're quite an optimist, thanks for the reply.
Downvoting a post can decrease pending rewards and make it less visible. Common reasons:
Submit
After normalizing the situation with the coronavirus, the price will go up.
Downvoting a post can decrease pending rewards and make it less visible. Common reasons:
Submit
This 'return to normality' is very vague, unfortunately. It can take one month, one year, 5 years.. who knows?
Thanks for the reply.
Downvoting a post can decrease pending rewards and make it less visible. Common reasons:
Submit
$trdo
!BEER
Downvoting a post can decrease pending rewards and make it less visible. Common reasons:
Submit
Dear @aezakami, it is the first time i am looking such graphic, normally all others are looking Fibonacci lines...:)
Your triangle will end on the middle of 2021 as i can suppose, than what will be?
Downvoting a post can decrease pending rewards and make it less visible. Common reasons:
Submit
Hello @intellihandling and thanks for stopping by!
I don't think that Bitcoin's price action will remain inside the triangle until we reach the end of it. It will eventually break the upper or lower line - the upper one, most likely. I didn't use on purpose any indicators or tools, because I wanted to reveal how easy BTC's price action can be placed in a pattern, especially on this big time-frame. Closing this current monthly candle above 9200$ will put us in a new bullish cycle, with new all time highs to be reached.
I was curious about the opinion of other users, about when and how we will break this pattern... but unfortunately there's no audience on this subject, or my blog is too unpopular.
Downvoting a post can decrease pending rewards and make it less visible. Common reasons:
Submit
This post has been rewarded by the Steem Community Curation Project. #communitycuration06
ps: You seem to be posting mostly on Steem blockchain.
Consider joining Project.hope community.
We like to share publications related to technology, blockchain, AI and economy, marketing etc. Link: https://steemit.com/trending/hive-175254.
Downvoting a post can decrease pending rewards and make it less visible. Common reasons:
Submit
Thanks guys for the support, will take a look.
Downvoting a post can decrease pending rewards and make it less visible. Common reasons:
Submit
This post has been rewarded by the Steem Community Curation Project. #communitycuration06
ps: You seem to be posting mostly on Steem blockchain.
Consider joining Project.hope community.
We like to share publications related to technology, blockchain, AI and economy, marketing etc. Link: https://steemit.com/trending/hive-175254
Downvoting a post can decrease pending rewards and make it less visible. Common reasons:
Submit
Downvoting a post can decrease pending rewards and make it less visible. Common reasons:
Submit
Congratulations to the following winner(s) of the bounty!
Find more bounties here and become a bounty hunter.
Find more bounties here and become a bounty hunter.
Find more bounties here and become a bounty hunter.
Downvoting a post can decrease pending rewards and make it less visible. Common reasons:
Submit