After peaking on January 4, 2018, ripple is still falling.
Many people who experience this declining trend are uneasy.
Is it to reduce such anxiety?

Ripple is still announcing its success.
French Bank Ripple Test
Amex Partnership
Listed on the largest exchange in France
Shinhan, Woori Bank ripple test
Korea-Japan Relations
61.3 billion won partnership with UpHold, an investor from Ripple
February 7th Yahoo finance summit
February 28, Canada Coimsquare Listing
March 13 Money 20/20 conference (Singapore)
In addition to the recounts listed here, there are many more.
This actually indicates that ripple is the starting point for our real life.
However, even in real life, many investors will be disappointed if the price of the actual XRP remains intact.
And actually, the price of the ripple is only about $ 1.3.
One of the biggest concerns of individual investors in this situation is the question of power.
"Indeed, the ripple power ripped off the ripple?"
I am not a ripple force, so I do not know exactly what it is.
However, the following conclusions were obtained through chart analysis.
"The forces of ripple remain."
Why did you get this conclusion?
You can analyze the actual ripple chart.
This analysis is also useful for stock investment.
There is a saying that 'trading volume precedes stock price'.
This means that investors' sentiments can be used to understand the flow of stock prices.
However, it is very difficult to understand the flow of stock prices through simple trading volume.
So a supplementary indicator is needed.
There is one helpful indicator that we can use to understand the volume of transactions.
It is OBV.
The OBV is calculated by adding the trading volume on the rising day and subtracting the trading volume on the falling day.
What can we learn from these OBVs?
It is that the majority shareholder can predict the movement of forces.
If the OBV rises, it means more people are expecting higher prices in the future.
And here is a big hand that led the rise.
If the OBV declines, more people expect the price to fall further.
In this case, because the big hand shook off, a large negative flow occurred.
So how did the ripple OBV move?

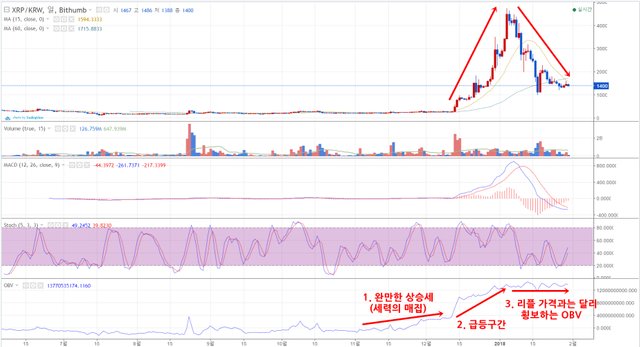
The ripple chart shows that the OBV increases slowly from November of 2017 until the surge in December.
This is a phenomenon that appears when the forces buy riffles.
When the price of riffle rises in December, the bureaucrats also buy, but many individual investors also participate in the purchase.
Therefore, the OBV also surges naturally.
Ripple prices will plunge after January 4, 2018.
In the face of such a plunge, many individual investors are selling with great losses.
However, there is a slight ups and downs in OBV, but the big trends of OBV are on the loose.
This means that it still retains the volume of ripples that the forces have gathered.
Then when will the forces raise the price of ripple again?
I do not know if it is the mind of the forces.
However, even if the forces move carefully, they can not deceive the transaction volume.
In particular, we can see the movement of forces through the movement of OBV.
Let's wait for the time when the OBV begins to increase again gently as in the "1" section of the chart above.
This means that the price of the ripple has dropped enough to satisfy the forces.
It is a low enough price for the forces to engage, so it has begun to buy.
So if you start seeing these moves, you might start with them at this point.
Let's wait a little more patience.
buena informacion amigo steemit. vote por ti, pasate por mi pagina y vota
Downvoting a post can decrease pending rewards and make it less visible. Common reasons:
Submit