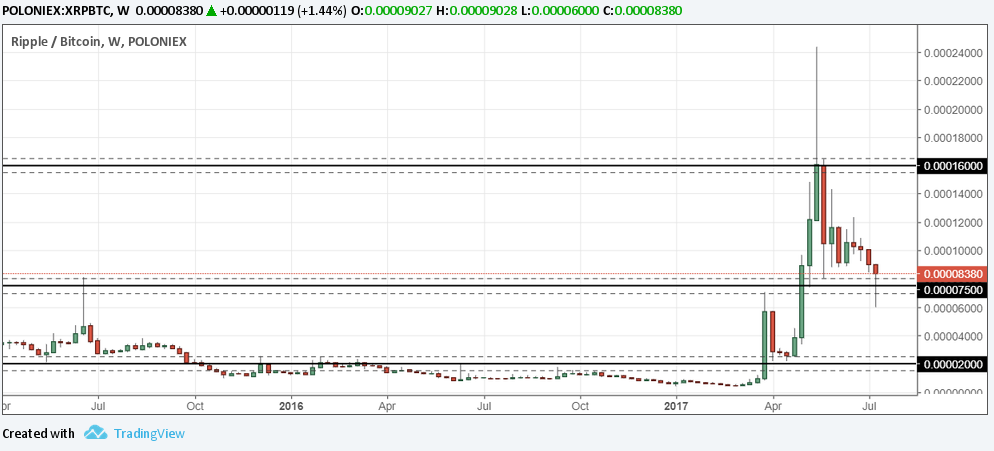
Ripple (XRP) is currently at its support zone which is between 0.000070 and 0.00008000. The latest candlestick appears on its weekly chart is a hammer candlestick, and this may indicate a reversal for its current downtrend movement. A place order may be placed above the 0.00008000 level, and the target price is the current resistance zone which is between 0.00015500 and 0.00016500. A stop price may be placed below the current support, which is below the 0.000070 level.
Interesting thoughts
Downvoting a post can decrease pending rewards and make it less visible. Common reasons:
Submit
very good information here!
Downvoting a post can decrease pending rewards and make it less visible. Common reasons:
Submit
thanks :)
Downvoting a post can decrease pending rewards and make it less visible. Common reasons:
Submit